


Improvement of Lattice Parameter Accuracy in Single Crystal XRD Based on a Laser-Induced X-Ray Source
doi: 10.11858/gywlxb.20240946
-
摘要: 高精度的晶格常数测量能够用于量化单晶的品质和材料的状态方程。为此,提出了一种迭代算法,用于求解基于激光单晶X射线衍射实验的伪Kossel投影中X射线与样品的作用点,从而提升晶格参数的测量精度。通过单晶铁的静态实验验证了该方法。随后,采用该方法获得了动态压缩下LiF单晶的压缩度和旋转角。这种方法为极端条件下单晶材料结构变化的原位表征提供了强有力的工具,在状态方程和相变研究方面具有重要意义。Abstract: The lattice parameter, measured with sufficient accuracy, can be utilized to evaluate the quality of single crystals and to determine the equation of state for materials. We propose an iterative method for obtaining more precise lattice parameters using the interaction points for the pseudo-Kossel pattern obtained from laser-induced X-ray diffraction (XRD). This method has been validated by the analysis of an XRD experiment conducted on iron single crystals. Furthermore, the method was used to calculate the compression ratio and rotated angle of an LiF sample under high pressure loading. This technique provides a robust tool forin-situcharacterization of structural changes in single crystals under extreme conditions. It has significant implications for studying the equation of state and phase transitions.
-
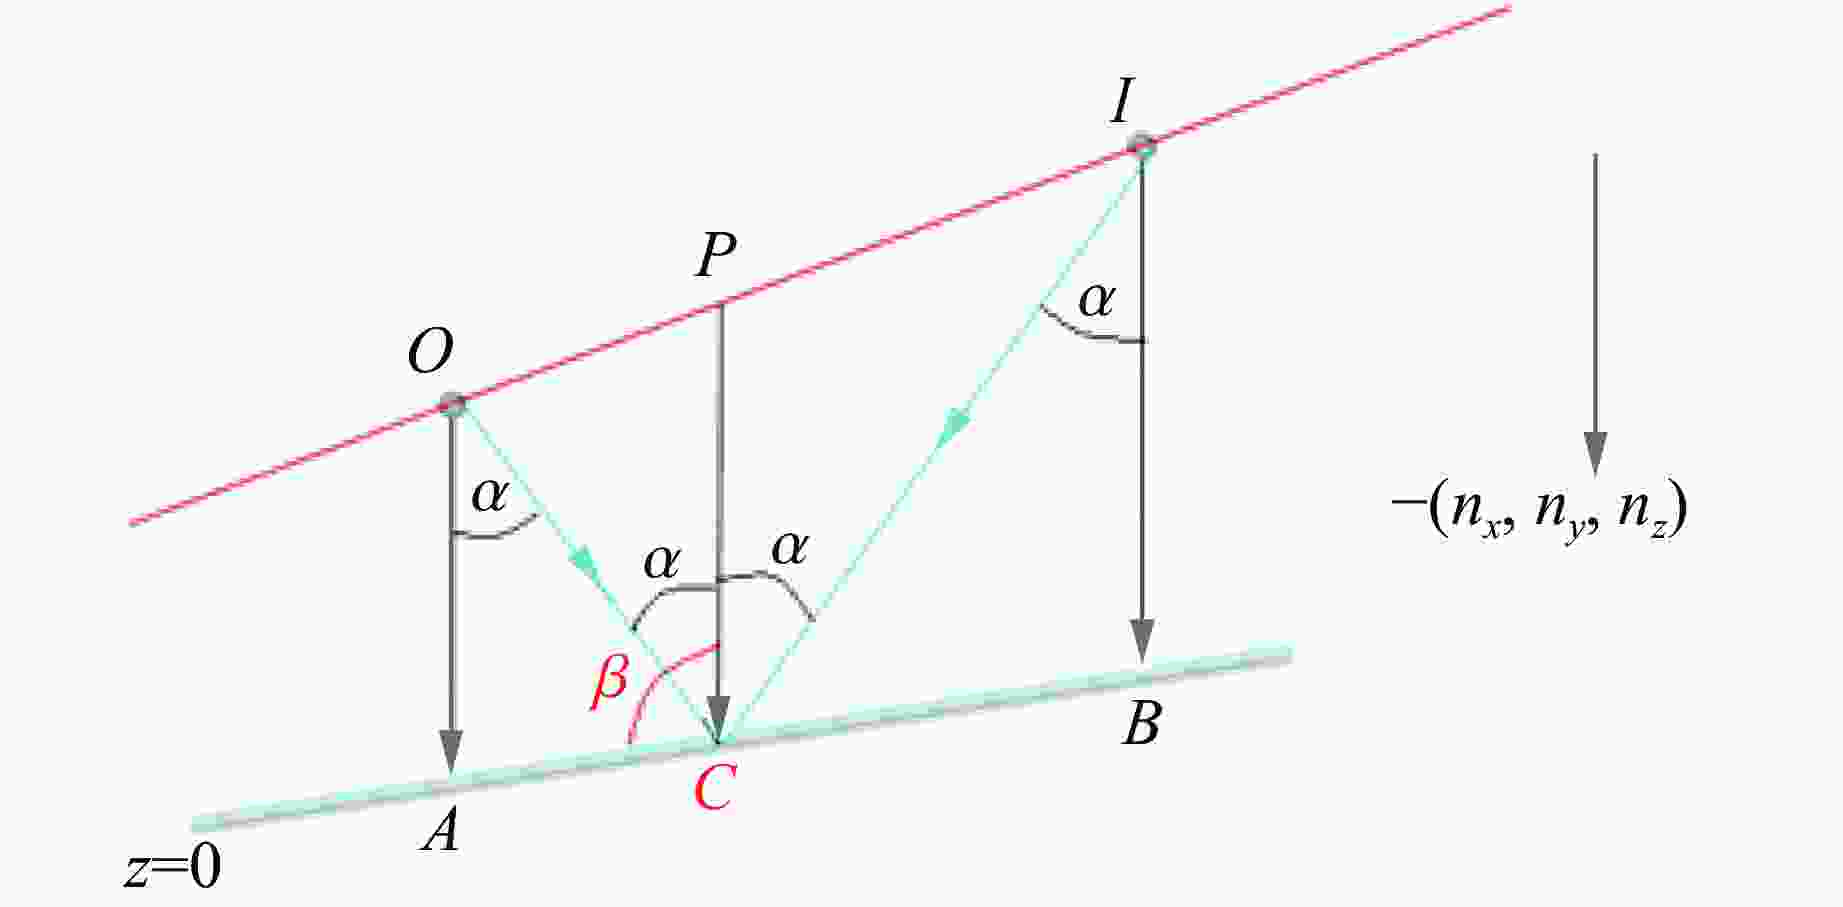
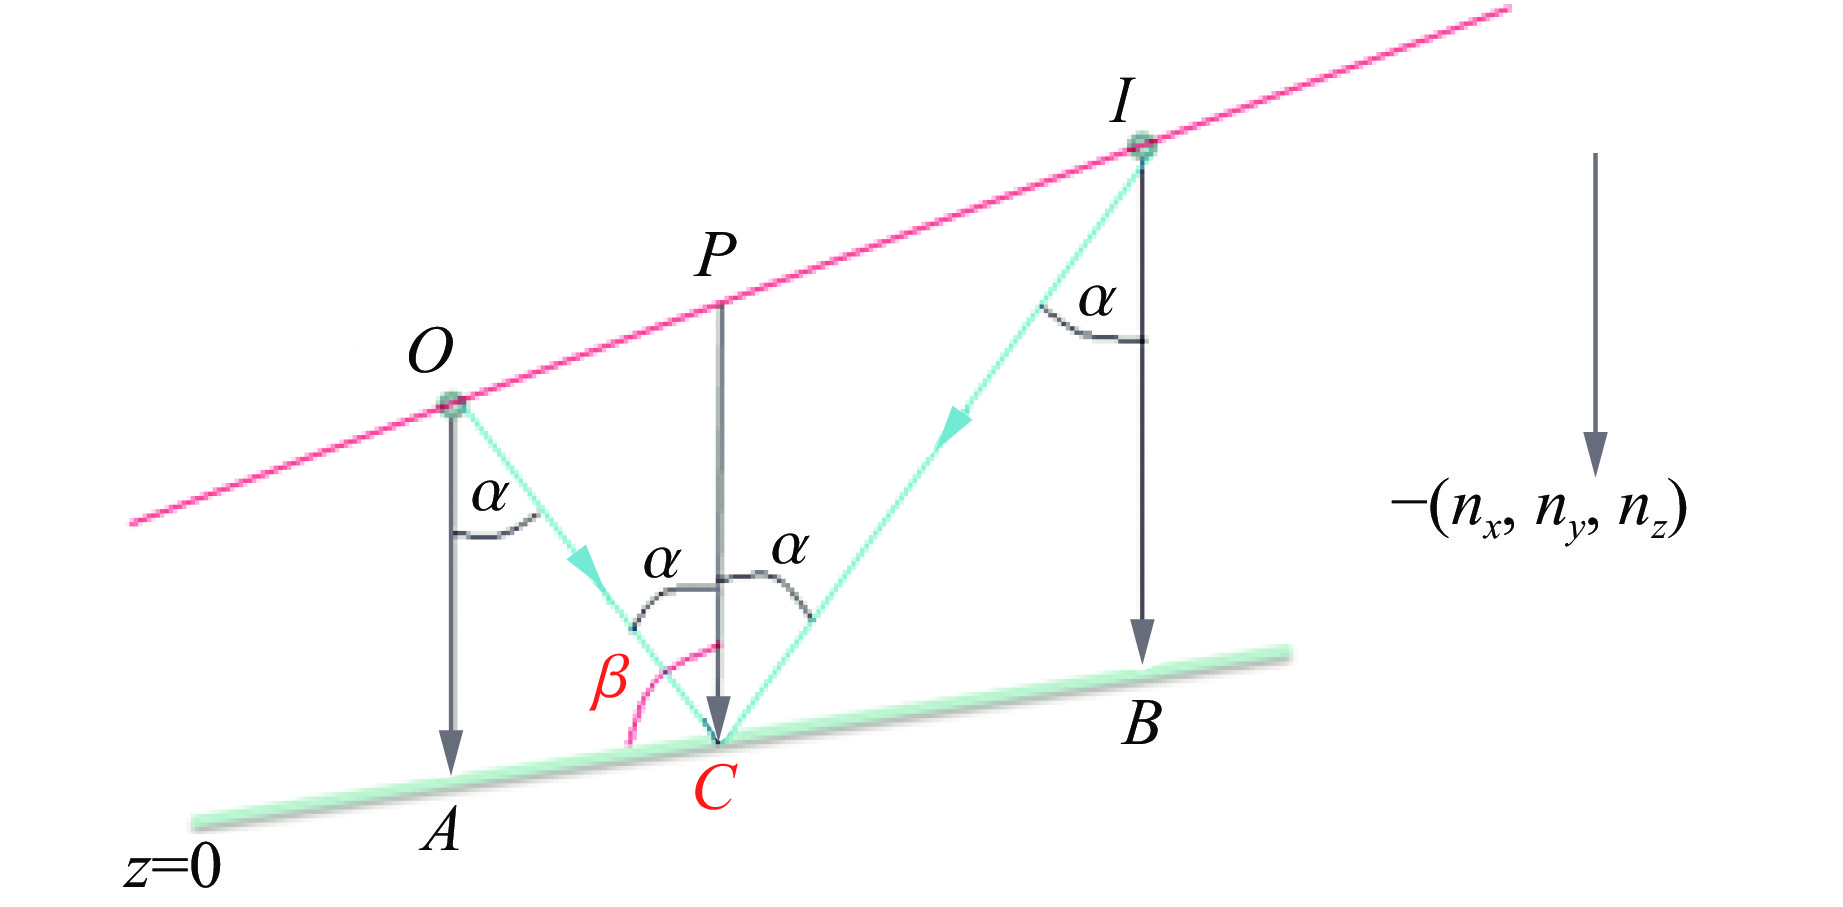
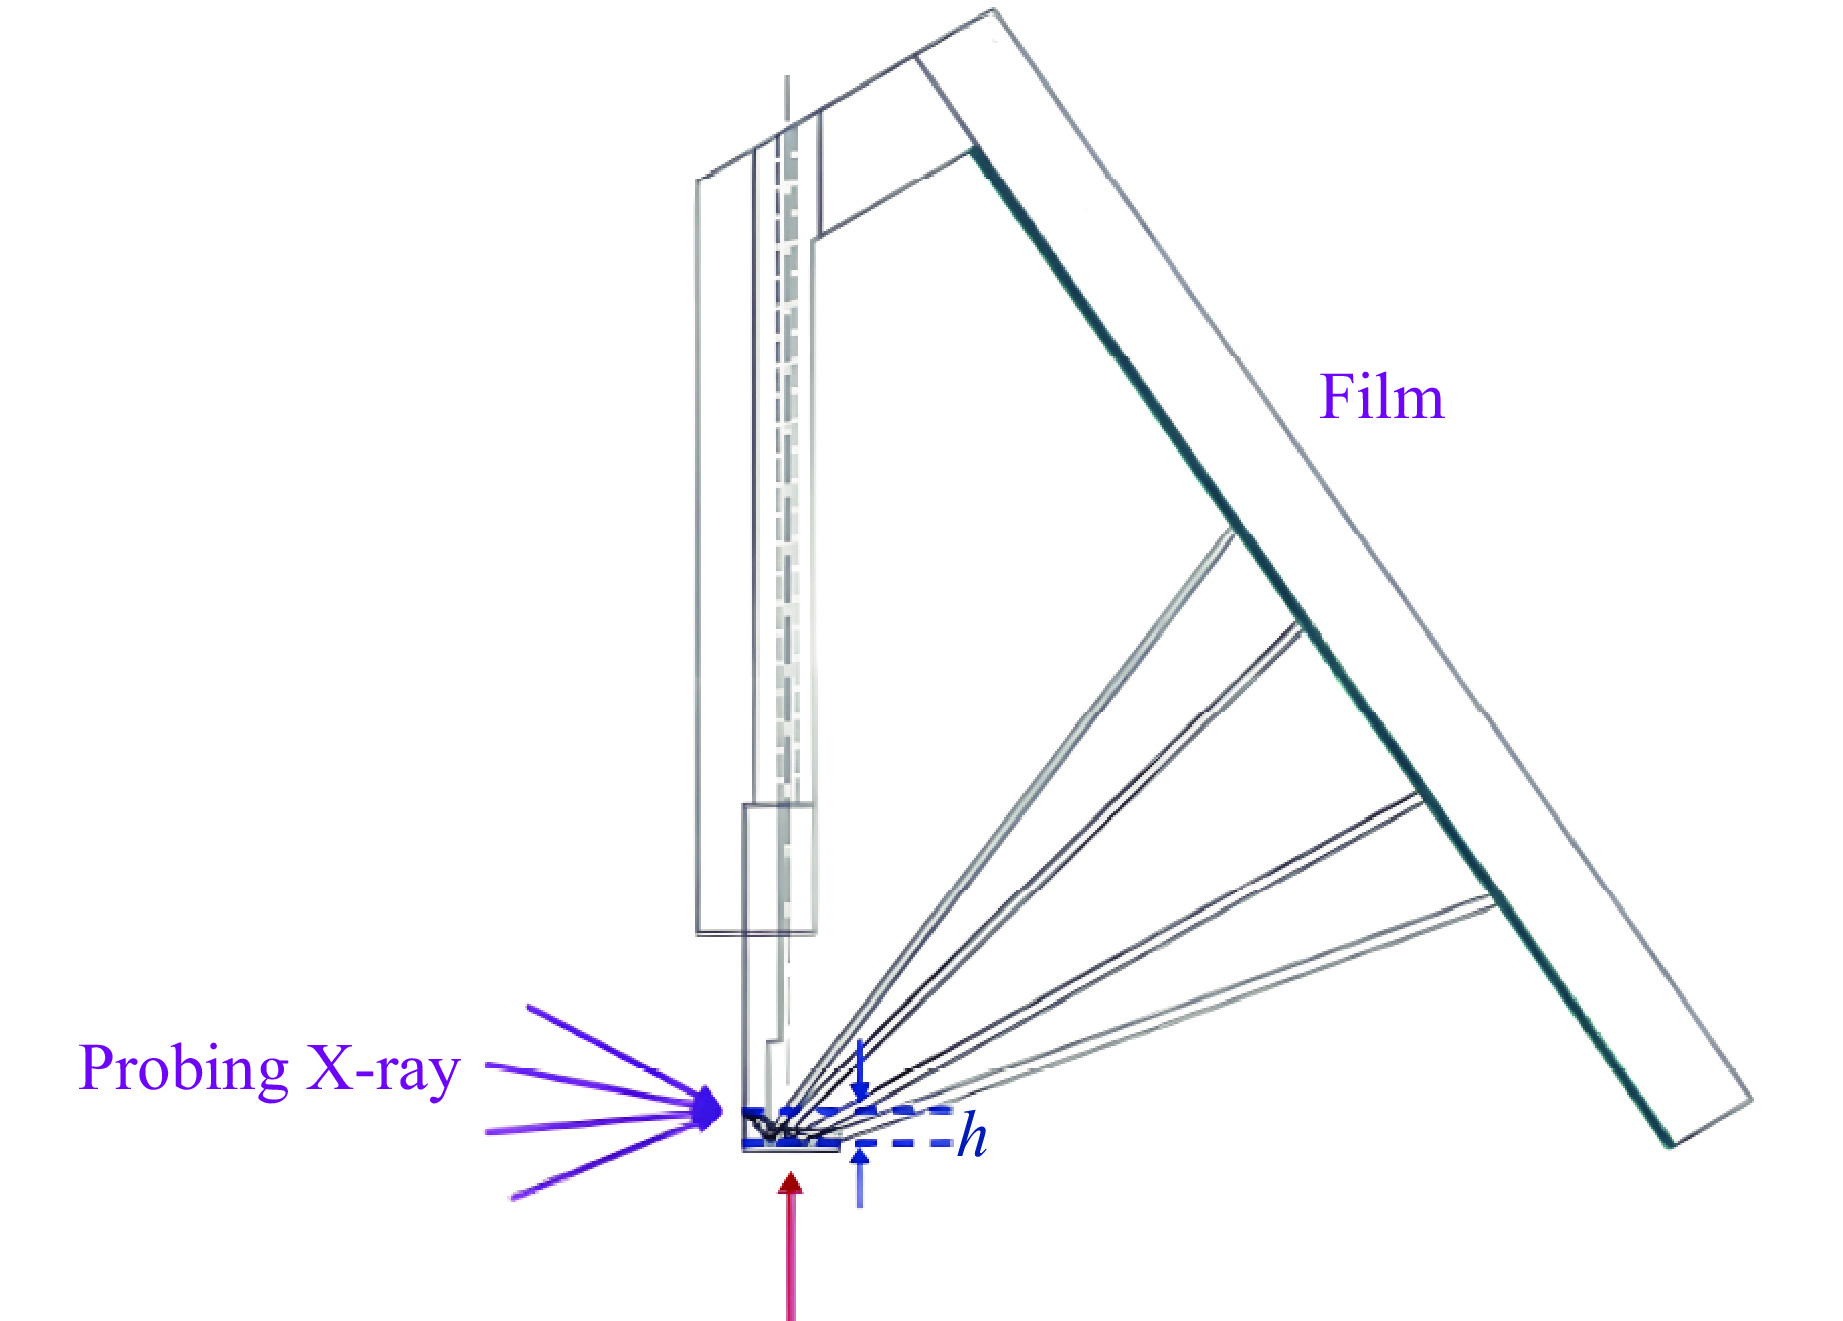
Figure 3. Schematic showing the geometry for the relation between the source point, the interaction point, and the diffracted image point (The diffracted X-ray trace is depicted as a blue solid line from OC to CI.)
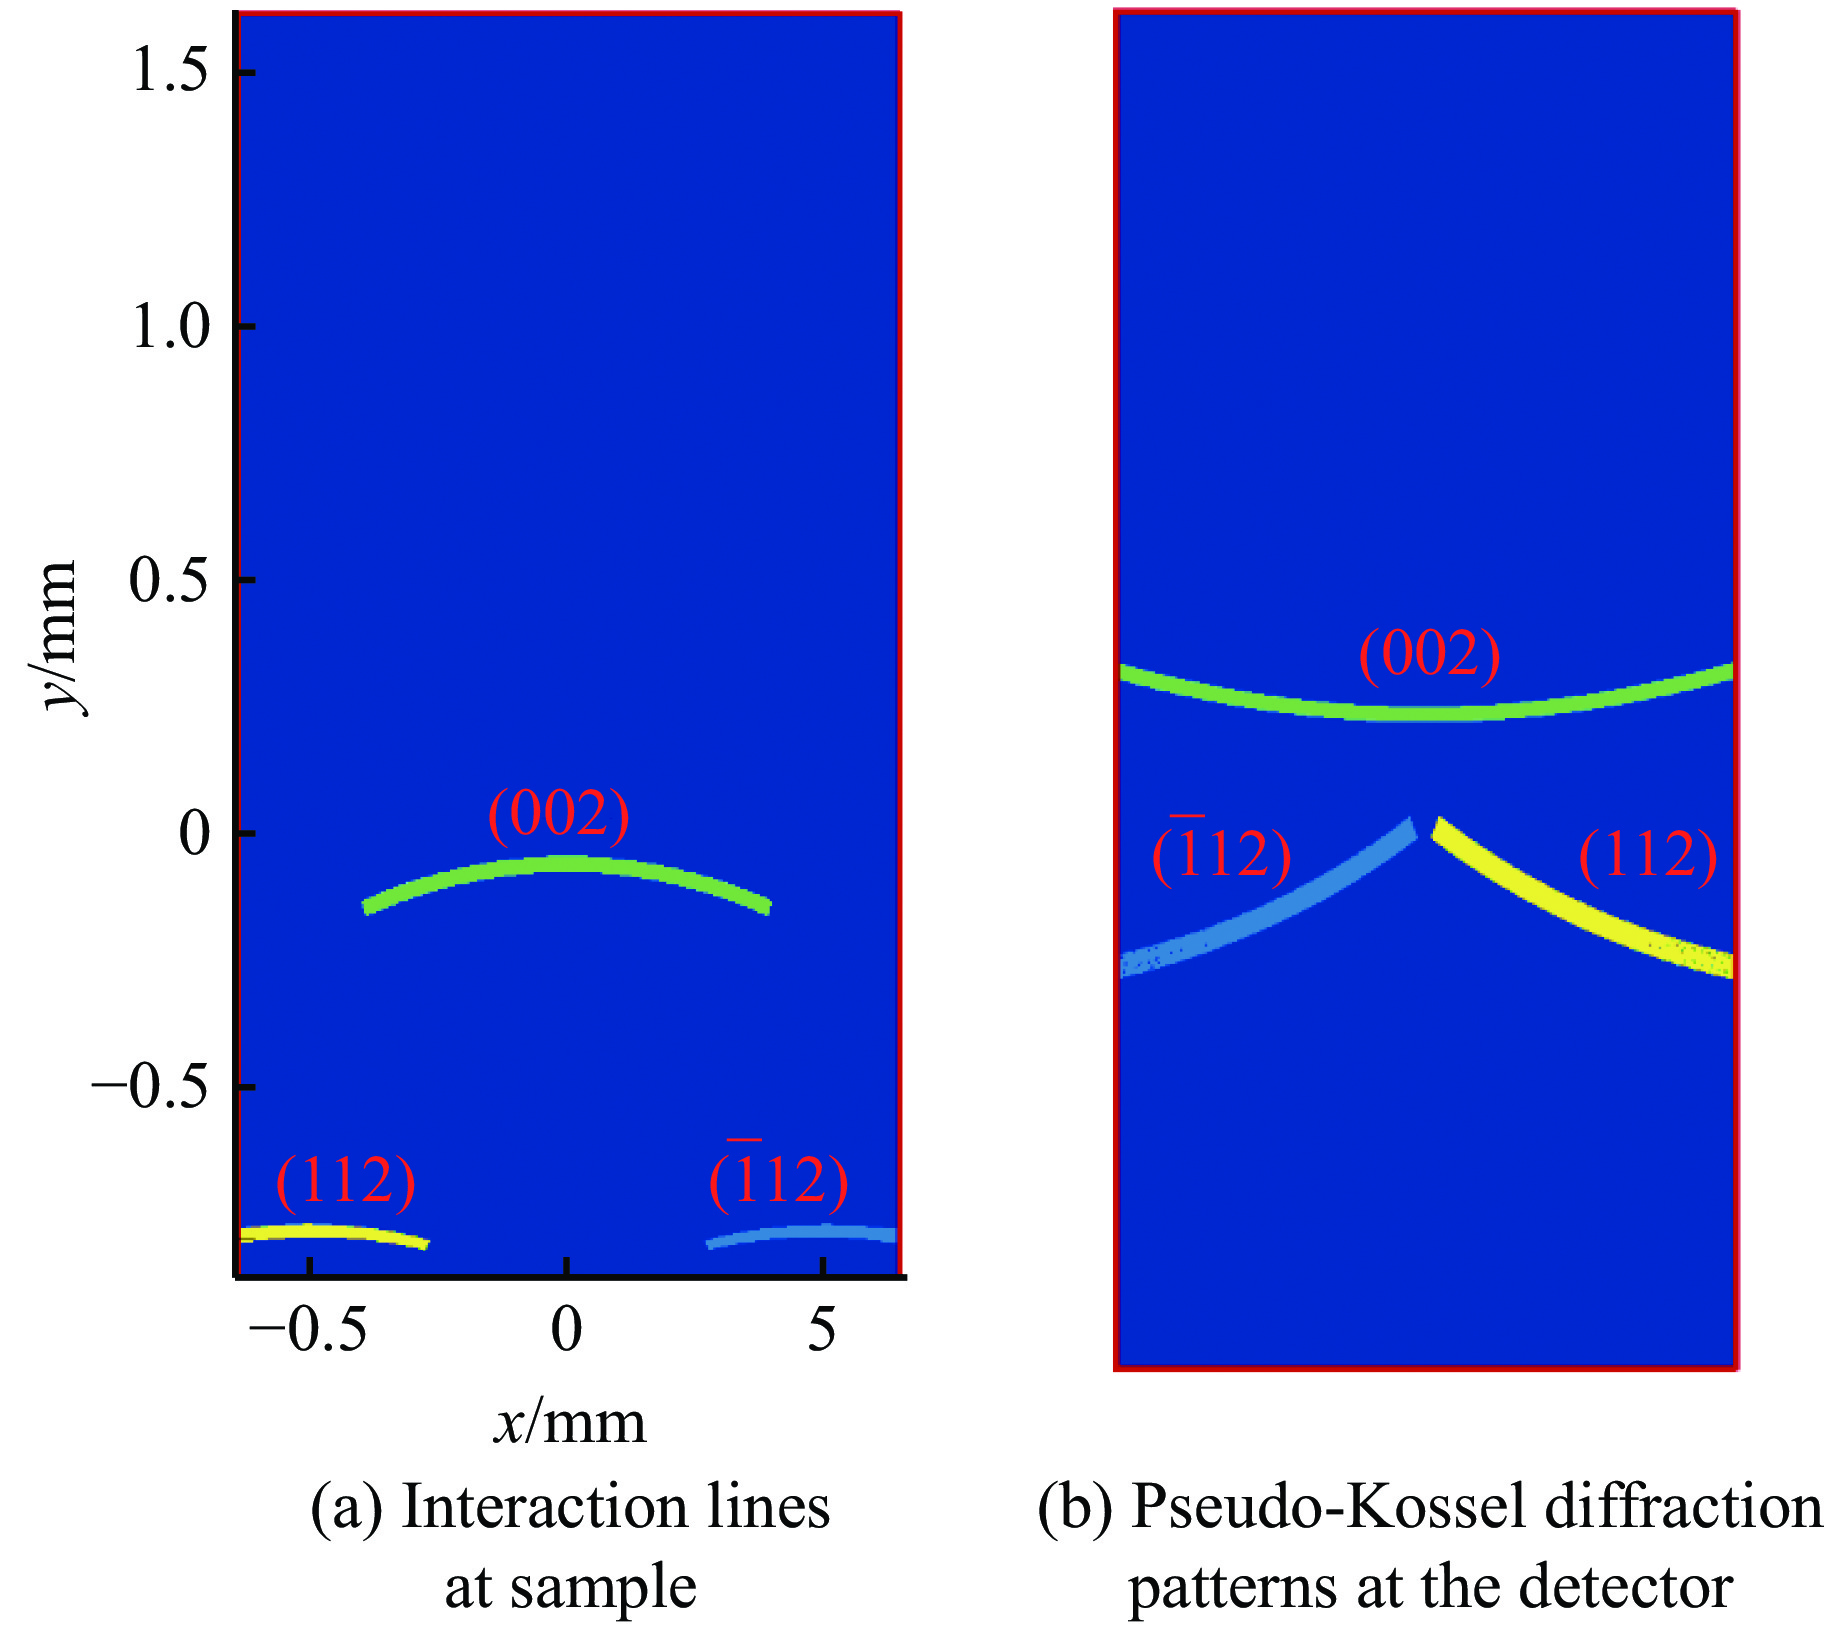
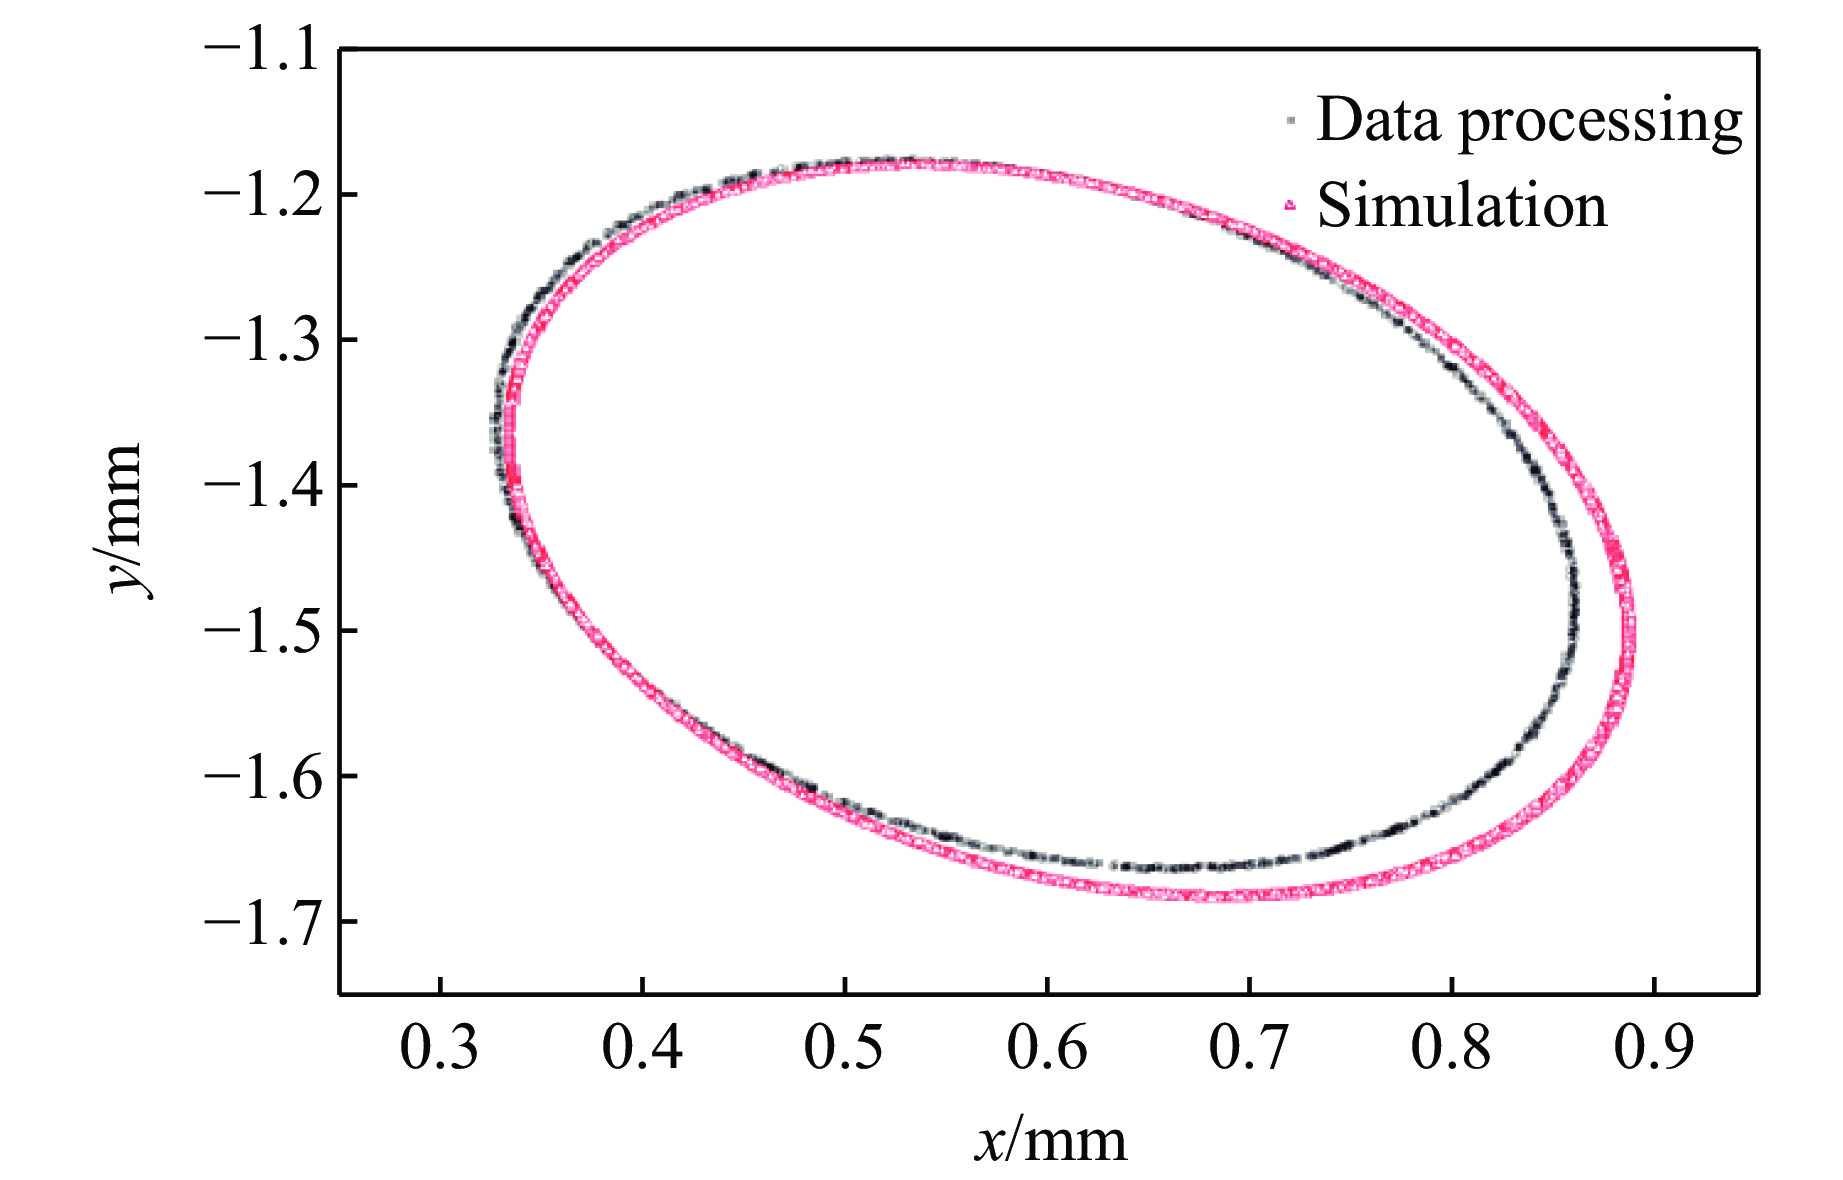
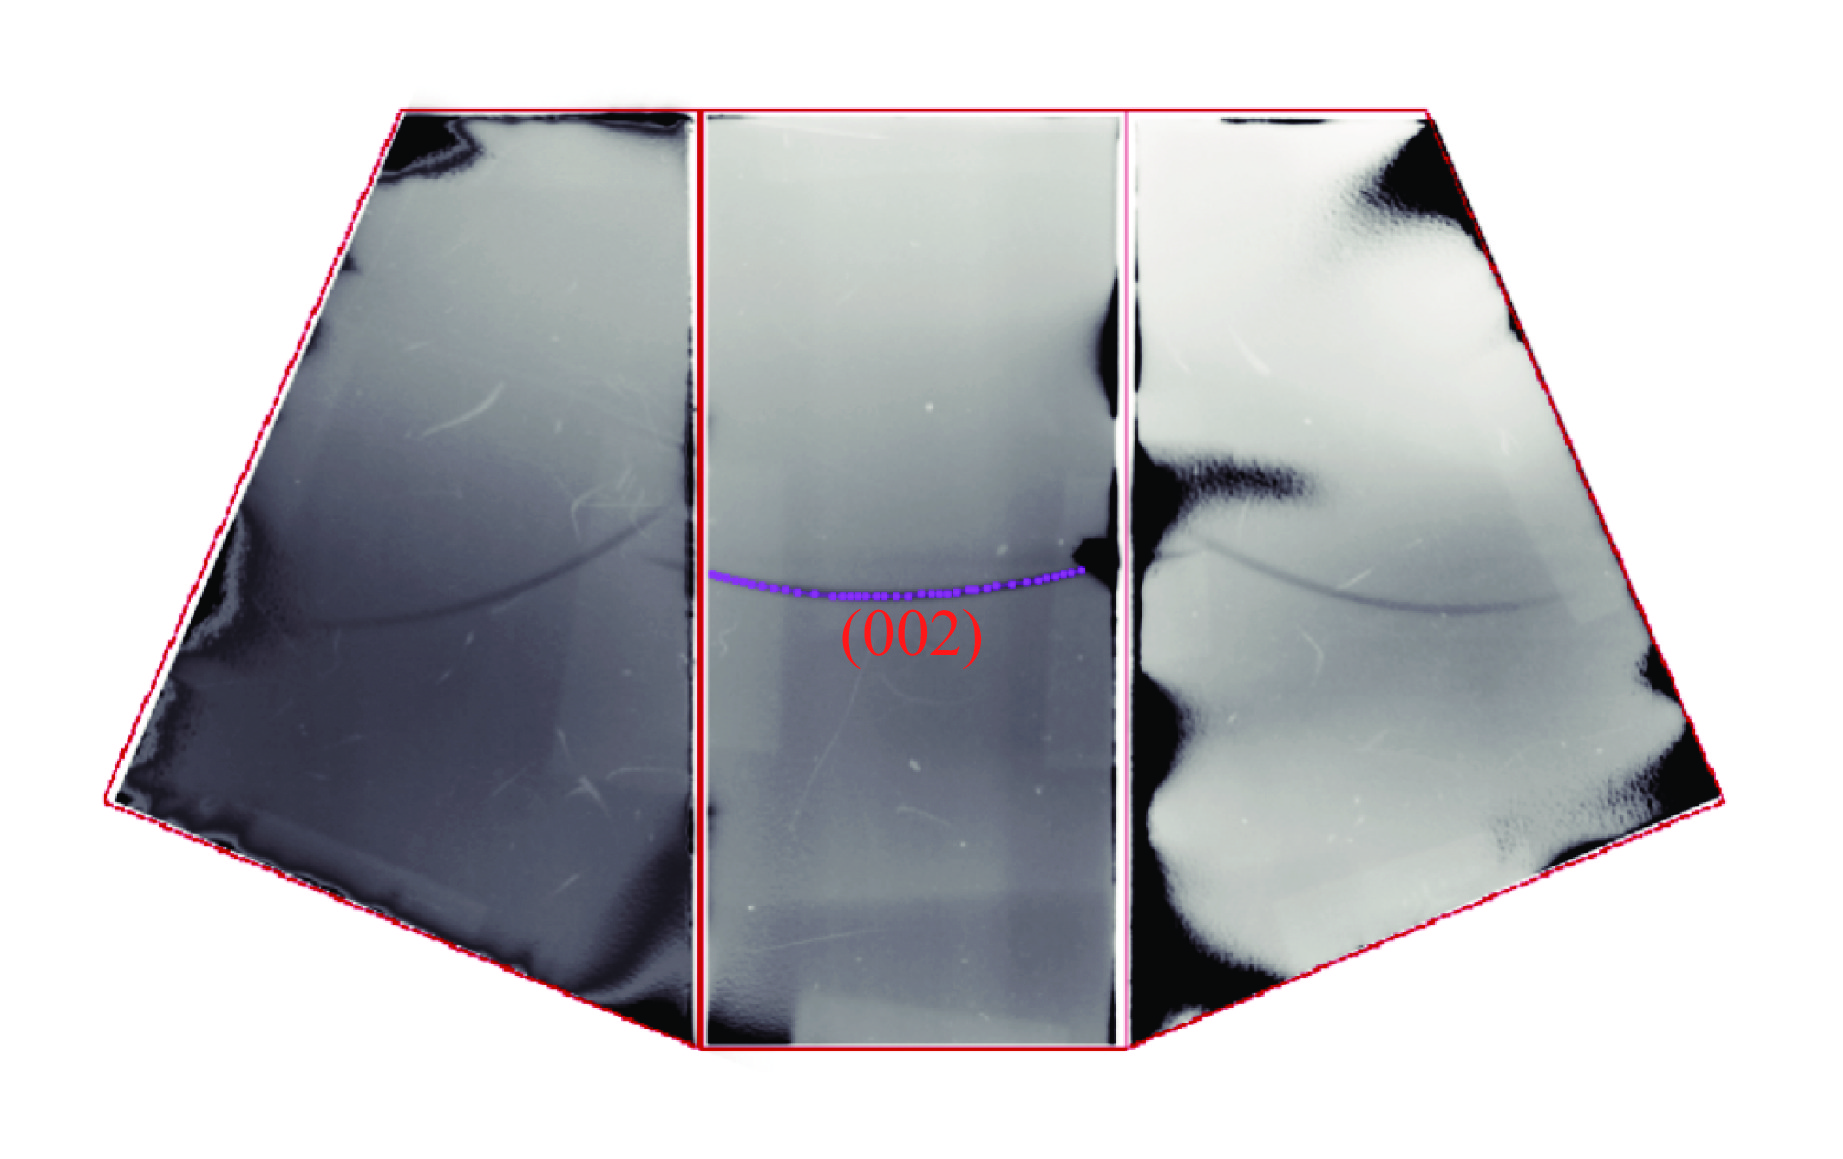
Figure 9. Interaction points identified using different methods for the diffraction line on the middle film detector in Fig.8
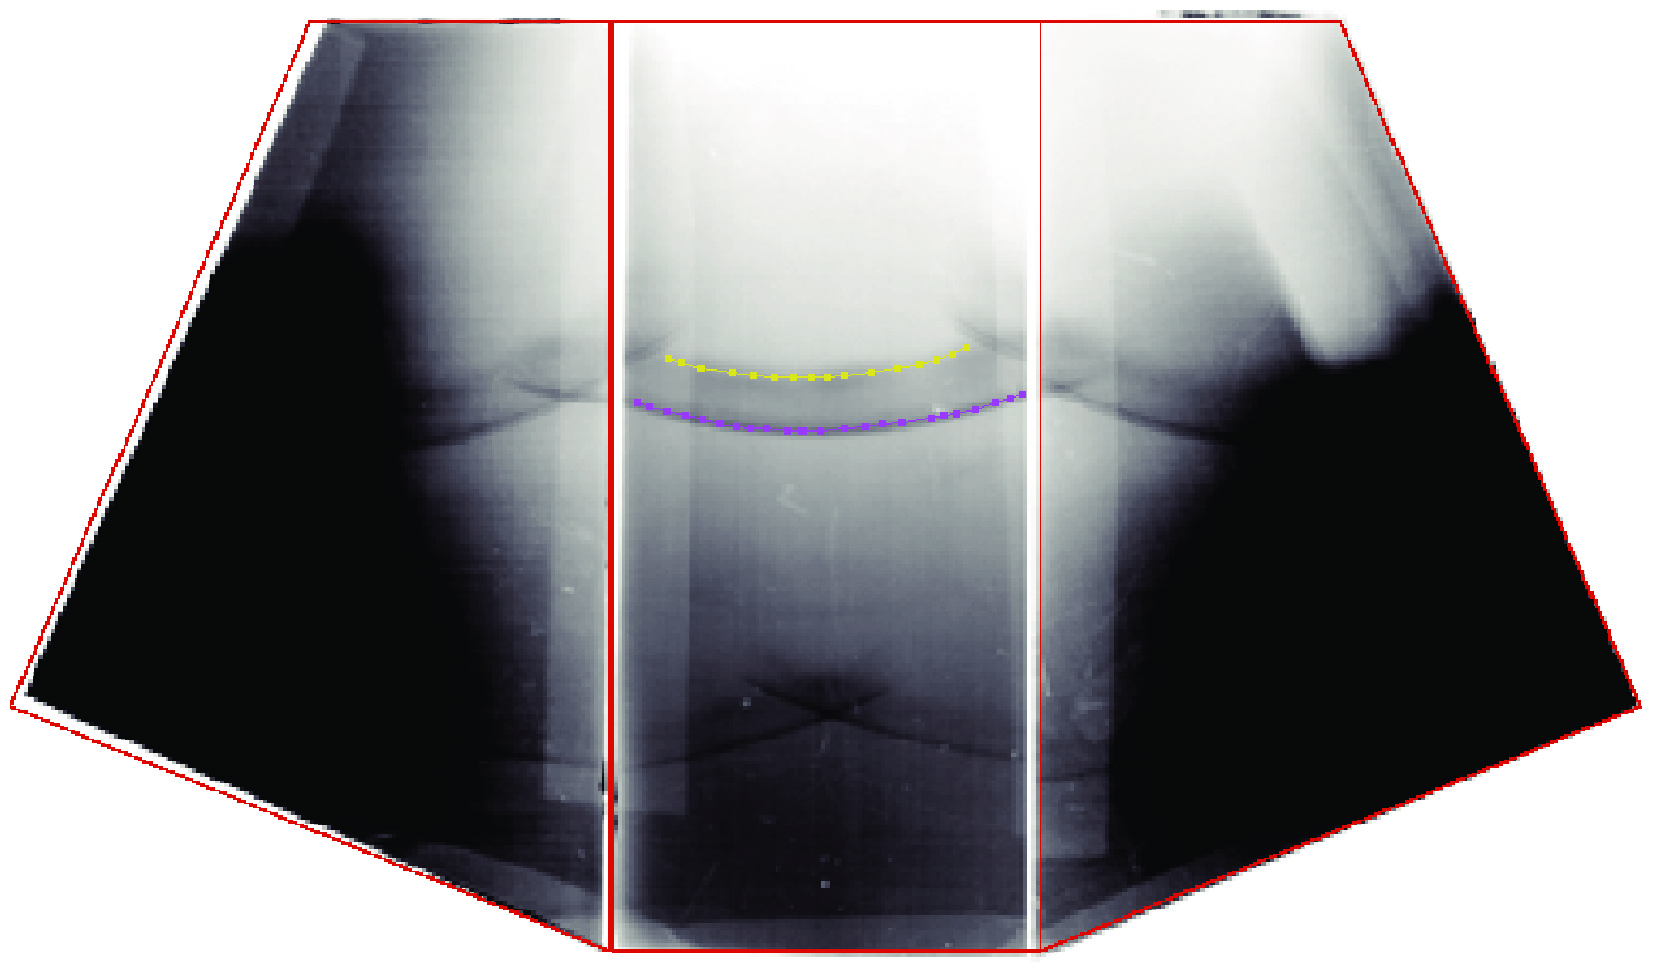
Figure 10. Diffraction pattern of the (100) LiF sample at about 20 GPa (Static state: red dotted line; compressed state: yellow dotted line)
Table 1. Results of an iterative process for simulation pattern
Times nx ny nz sin θ Error Cosine Angle of the cosine/(°) True − 0.53452 0.37796 0.75593 0.97920 1 − 0.52335 0.34581 0.77879 0.97826 0.000352 0.99915 2.36 2 − 0.52711 0.37146 0.76432 0.97978 0.000154 0.99992 0.72 3 − 0.52729 0.37272 0.76357 0.97985 0.000149 0.99993 0.68 Note: Cosine is the cosine value of the true unit vector (nx, ny, nz) of the normal direction to the reflection plane and the analyzed one.  下载: 导出CSV
Table 2. Results of the iterative method
Times sin θ Difference/% 1 0.6435 1.76 50 0.6523 0.35
下载: 导出CSV
-
[1] CHEN S, HOU Q Y, WANG Q N, et al. Progress on synchrotron based in-situ dynamic X-ray diagnostics and its applications [J]. Chinese Journal of High Pressure Physics, 2023, 37(5): 050104. doi: 10.11858/gywlxb.20230747 [2] COPPARI F, SMITH R F, THORN D B, et al. Optimized X-ray sources for X-ray diffraction measurements at the Omega Laser Facility [J]. Review of Scientific Instruments, 2019, 90(12): 125113. doi: 10.1063/1.5111878 [3] SPAETH M L, MANES K R, KALANTAR D H, et al. Description of the NIF laser [J]. Fusion Science and Technology, 2016, 69(1): 25–145. doi: 10.13182/FST15-144 [4] SUZUKI-VIDAL F, CLAYSON T, STEHLÉ C, et al. First radiative shock experiments on the SG-Ⅱ laser [J]. High Power Laser Science and Engineering, 2021, 9: e27. doi: 10.1017/hpl.2021.17 [5] HE X T, ZHANG W Y. Inertial fusion research in China [J]. The European Physical Journal D, 2007, 44(2): 227–231. doi: 10.1140/epjd/e2007-00005-1 [6] KALANTAR D H, BRINGA E, CATURLA M, et al. Multiple film plane diagnostic for shocked lattice measurements (invited) [J]. Review of Scientific Instruments, 2003, 74(3): 1929–1934. doi: 10.1063/1.1538325 [7] KALANTAR D H, BELAK J F, COLLINS G W, et al. Direct observation of the α-ε transition in shock-compressed iron via nanosecond X-ray diffraction [J]. Physical Review Letters, 2005, 95(7): 075502. doi: 10.1103/PhysRevLett.95.075502 [8] LI J, CHEN X H, WU Q, et al. Experimental investigation on dynamic lattice response by in-situ Xray diffraction method [J]. Acta Physica Sinica, 2017, 66(13): 136101. doi: 10.7498/aps.66.136101 [9] RYGG J R, SMITH R F, LAZICKI A E, et al. X-ray diffraction at the National Ignition Facility [J]. Review of Scientific Instruments, 2020, 91(4): 043902. doi: 10.1063/1.5129698 [10] SHELDRICK G M. A short history of SHELX [J]. Acta Crystallographica Section A: Foundations of Crystallography, 2008, 64(1): 112–122. doi: 10.1107/S0108767307043930 [11] HAWRELIAK J, COLVIN J D, EGGERT J H, et al. Analysis of the X-ray diffraction signal for the α-ε transition in shock-compressed iron: simulation and experiment [J]. Physical Review B, 2006, 74(18): 184107. doi: 10.1103/PhysRevB.74.184107 [12] LIDER V V. X-ray divergent-beam (Kossel) technique: a review [J]. Crystallography Reports, 2011, 56(2): 169–189. doi: 10.1134/S106377451102012X [13] CHEN X H, XUE T, LIU D B, et al. Graphical method for analyzing wide-angle X-ray diffraction [J]. Review of Scientific Instruments, 2018, 89(1): 013904. doi: 10.1063/1.5003452 [14] LIDER V V. Precise determination of crystal lattice parameters [J]. Physics-Uspekhi, 2020, 63(9): 907–928. doi: 10.3367/UFNe.2019.07.038599 -

 下载:
下载:


计量
- 文章访问数: 869
- HTML全文浏览量: 308
- PDF下载量: 50
