


Blast Resistance and Prediction of Bi-Directional Corrugated Sandwich Tubes under Internal Blast Loading
-
摘要: 受孔雀螳螂虾前鄂抗冲击区结构启发,设计并制备了双向波纹夹芯管结构,采用实验和数值模拟相结合的方法研究了其在内爆炸载荷下的动态响应及能量吸收机制。实验获得了结构的外管中点最大挠度和3种典型变形模式:局部塑性变形、塑性大变形以及撕裂破坏。内外管中点最大挠度和结构最终变形模态的数值模拟结果与实验结果吻合较好。通过数值模拟研究了芯层波纹数、内外管壁厚以及炸药质量对外管中点最大挠度和能量吸收特性的影响,结果表明:随着波纹数增大,结构比吸能先增大后减小;增大内管壁厚和减小外管壁厚能有效地提高结构的抗爆性能,当结构内管壁厚为2.5 mm、外管壁厚为1.5 mm时,相比于内管壁厚为1.5 mm、外管壁厚为2.5 mm时,外管中点最大挠度降低了67.6%,质量降低了6.0%;随着TNT当量的增加,内管吸收的能量占比逐渐下降,而芯层和外管吸收的能量占比增加。建立了BP(back propagation)神经网络模型、PSO-BP(particle swarm optimization-back propagation)神经网络模型以及响应面分析模型,分别对结构的比吸能与外管中点最大挠度进行预测,优化了所提出的结构。Abstract: A bi-directional corrugated sandwich tube structure was proposed, inspired by the front jaw of peacock mantis shrimp. The dynamic responses and energy absorption characteristics of bi-directional corrugated sandwich tubes under inner blast loading were investigated numerically and experimentally. It was found that three typical deformation modes including localized plastic deformation, elliptical plastic large deformation and laceration. The numerical results of the mid-point deflection of the outer tube and the final deformation mode of the structure agree well with the experimental results. Subsequently, the effects of the number of corrugation of the bi-directional corrugated core tube, the inner and outer tube wall thicknesses and TNT dose on its dynamic response and energy absorption characteristics were investigated thoroughly. The results show that the energy absorption ratio of the structure increases first, and then decreases with the increase of the number of corrugation. Increasing the inner tube wall thickness and decreasing the outer tube wall thickness can improve the shock resistance performance. Compared with the inner tube wall thickness of 1.5 mm and an outer tube wall thickness of 2.5 mm, the structure with an inner tube wall thickness of 2.5 mm and an outer tube wall thickness of 1.5 mm can reduce the maximum mid-point deflection (MD) of the outer tube by 67.6% and reduce the mass by 6.0%. As the TNT dose increases, the percentage of energy absorbed by the inner tube decreases gradually, while the percentage of energy absorbed by the core and outer tube increases. Finally, the specific energy absorption (SEA) of the structure and MD of the outer tube were predicted using BP (back propagation) neural network model, PSO-BP (particle swarm optimization-back propagation) neural network model, and RSM (response surface methodology) model to optimize the proposed structure.
-
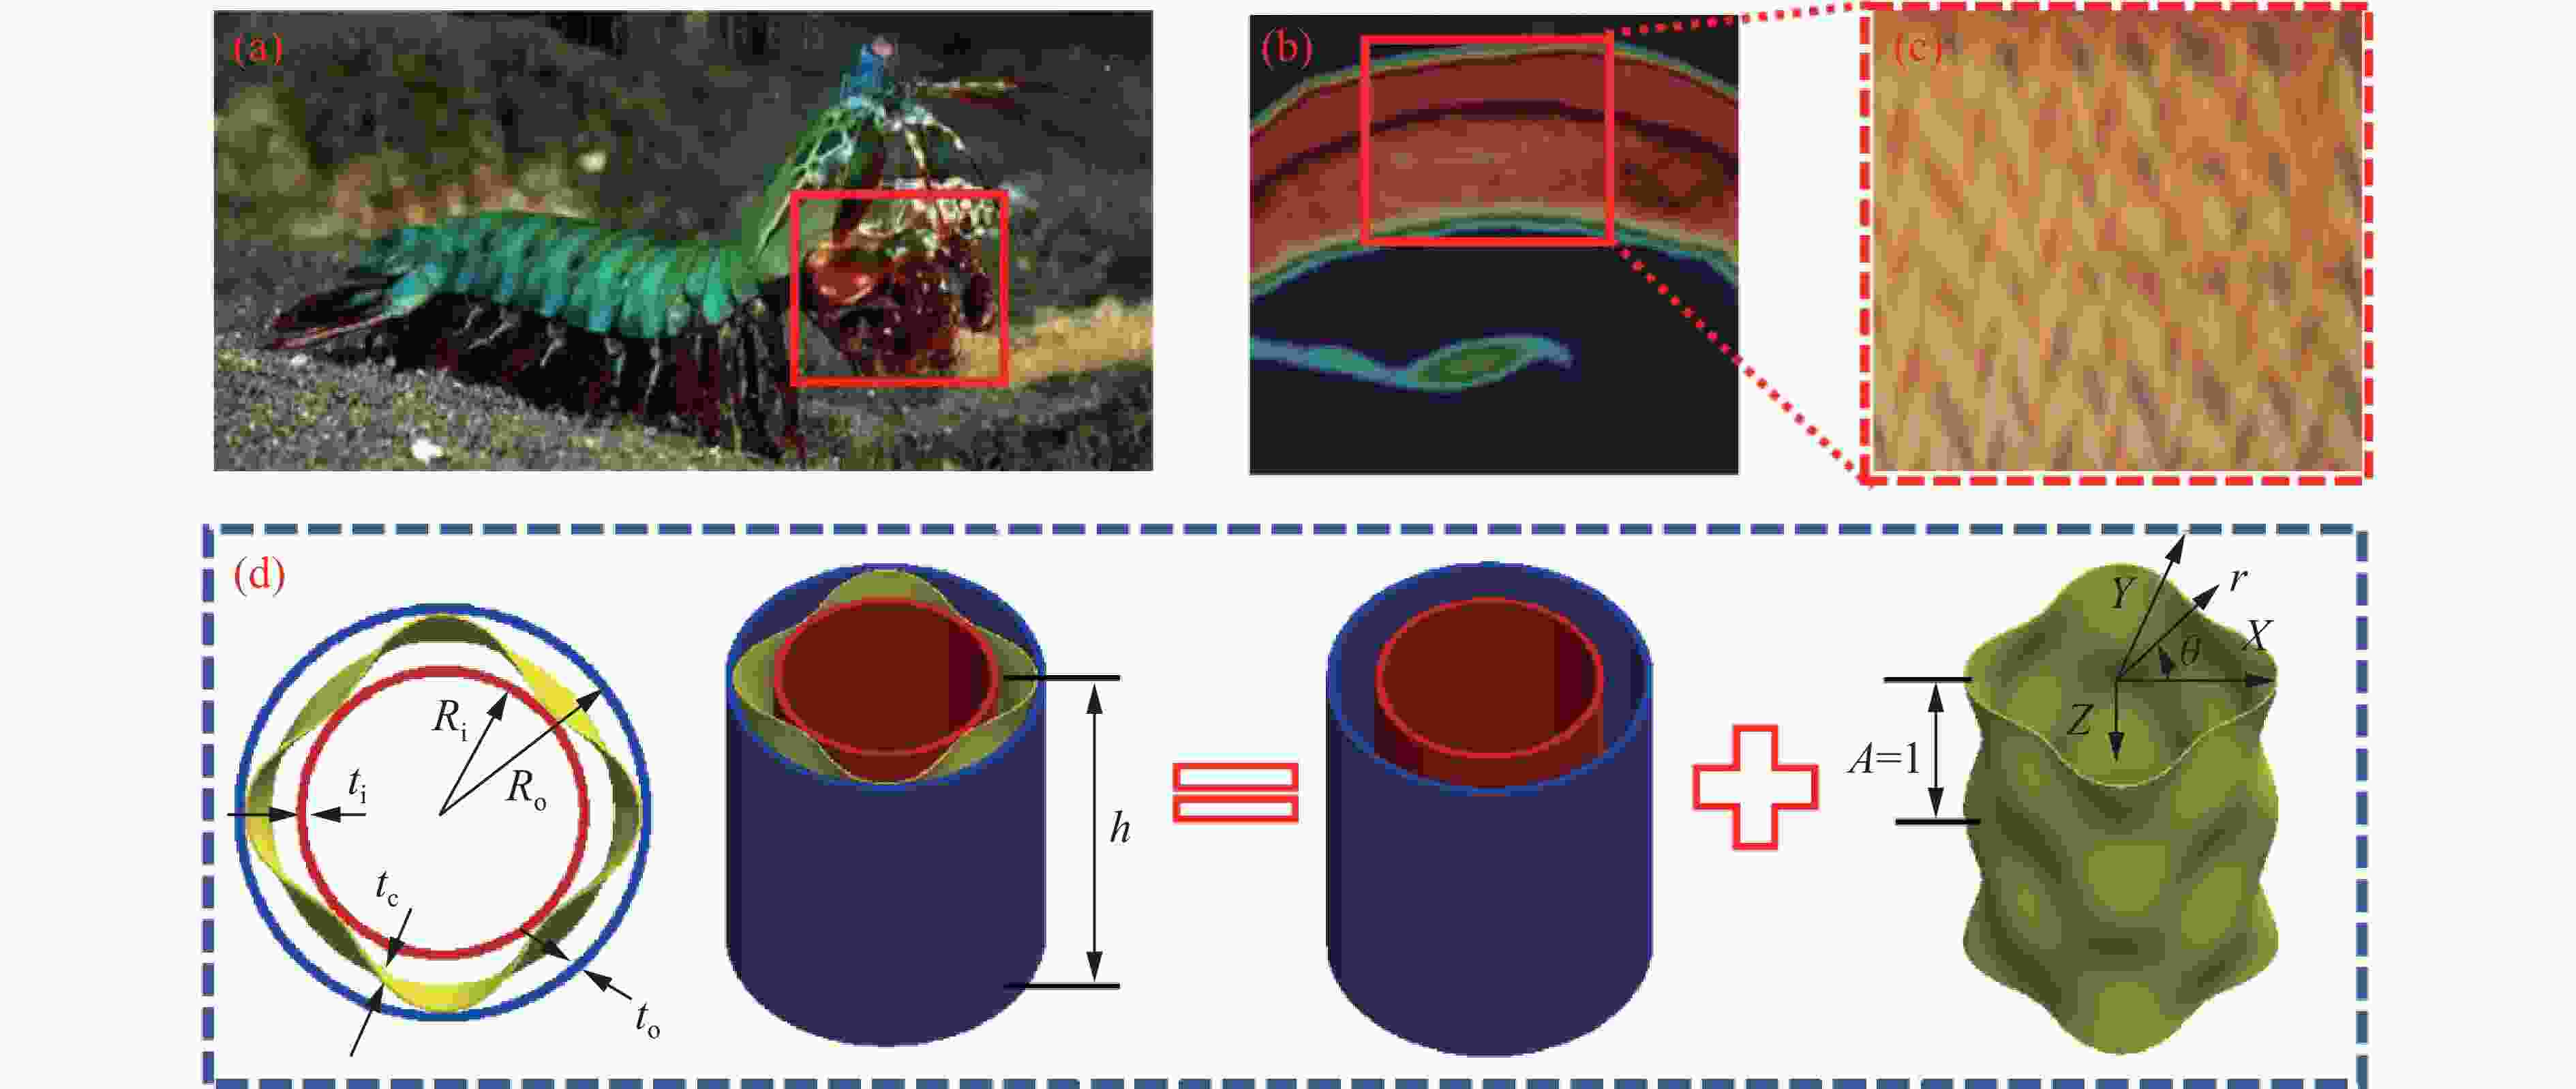
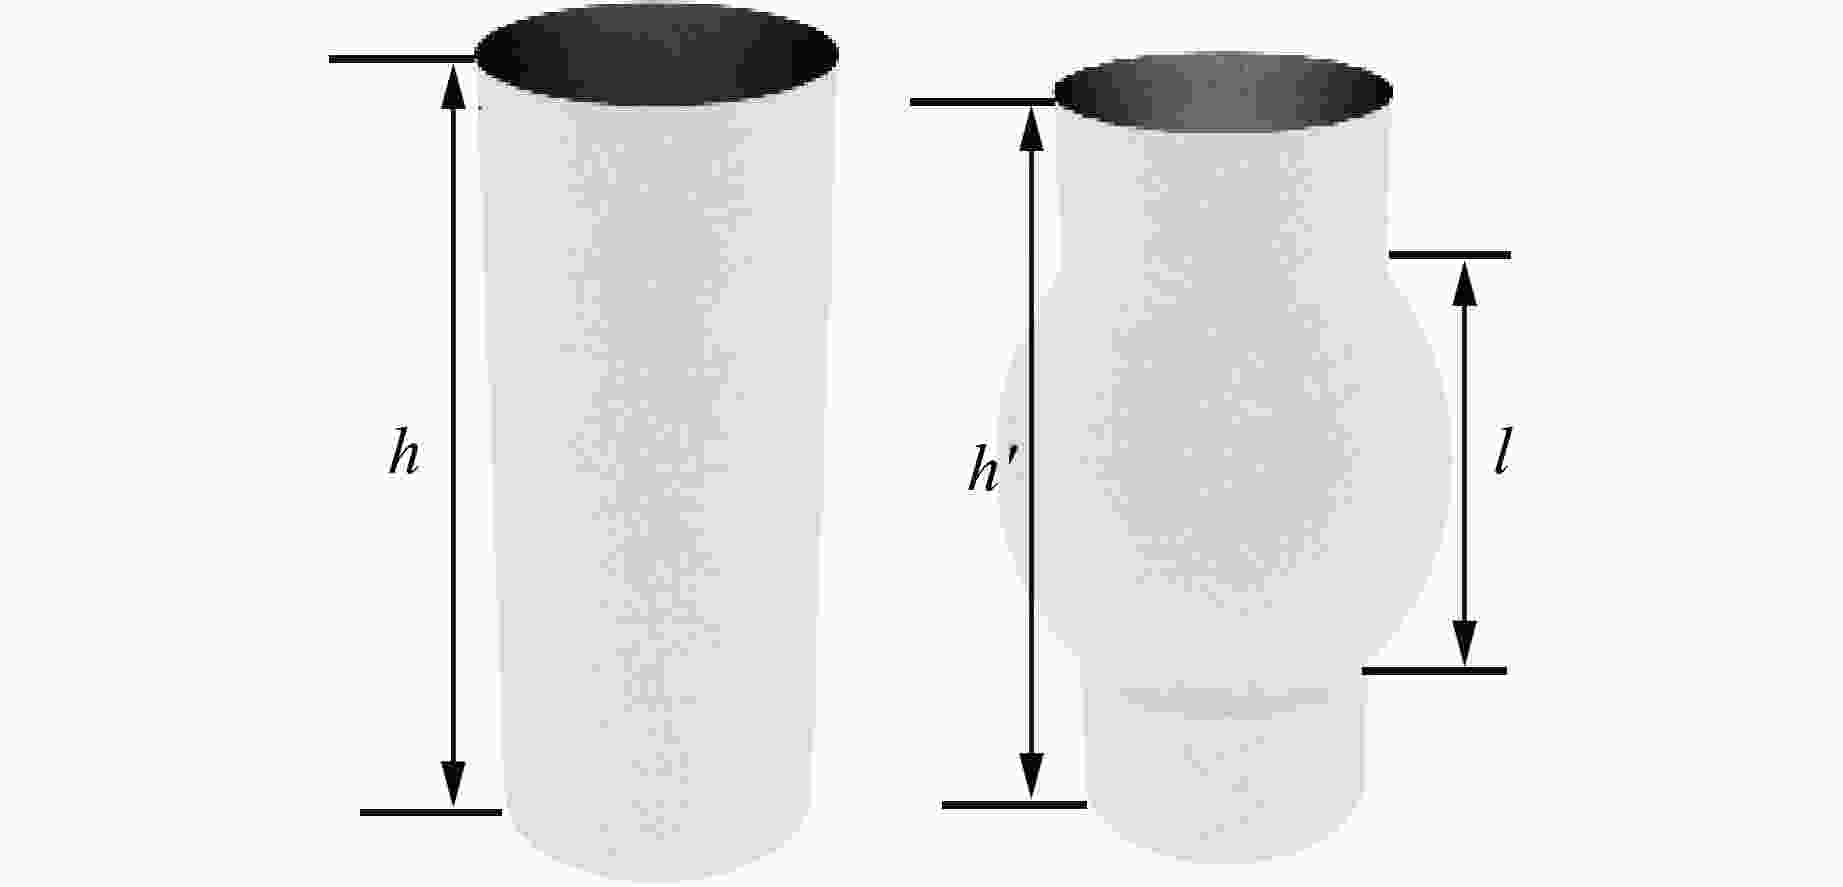
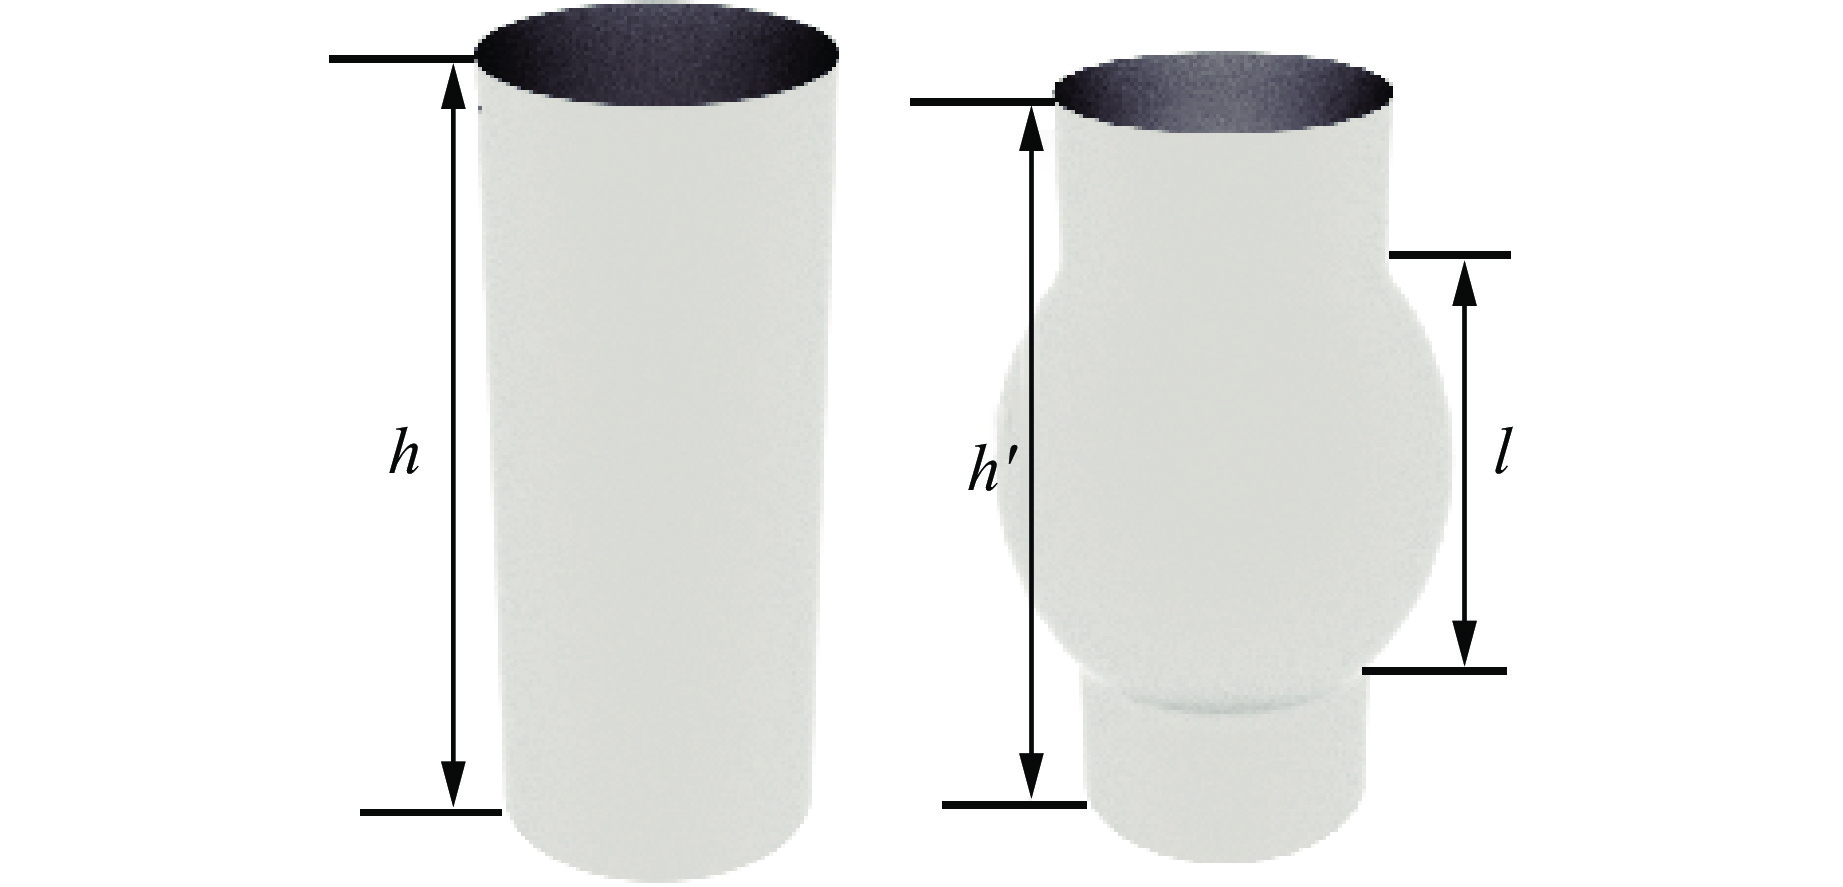
图 4 双向波纹管内外管变形图
Figure 4. Deformation diagram of inner and outer tubes of bidirectional bellows
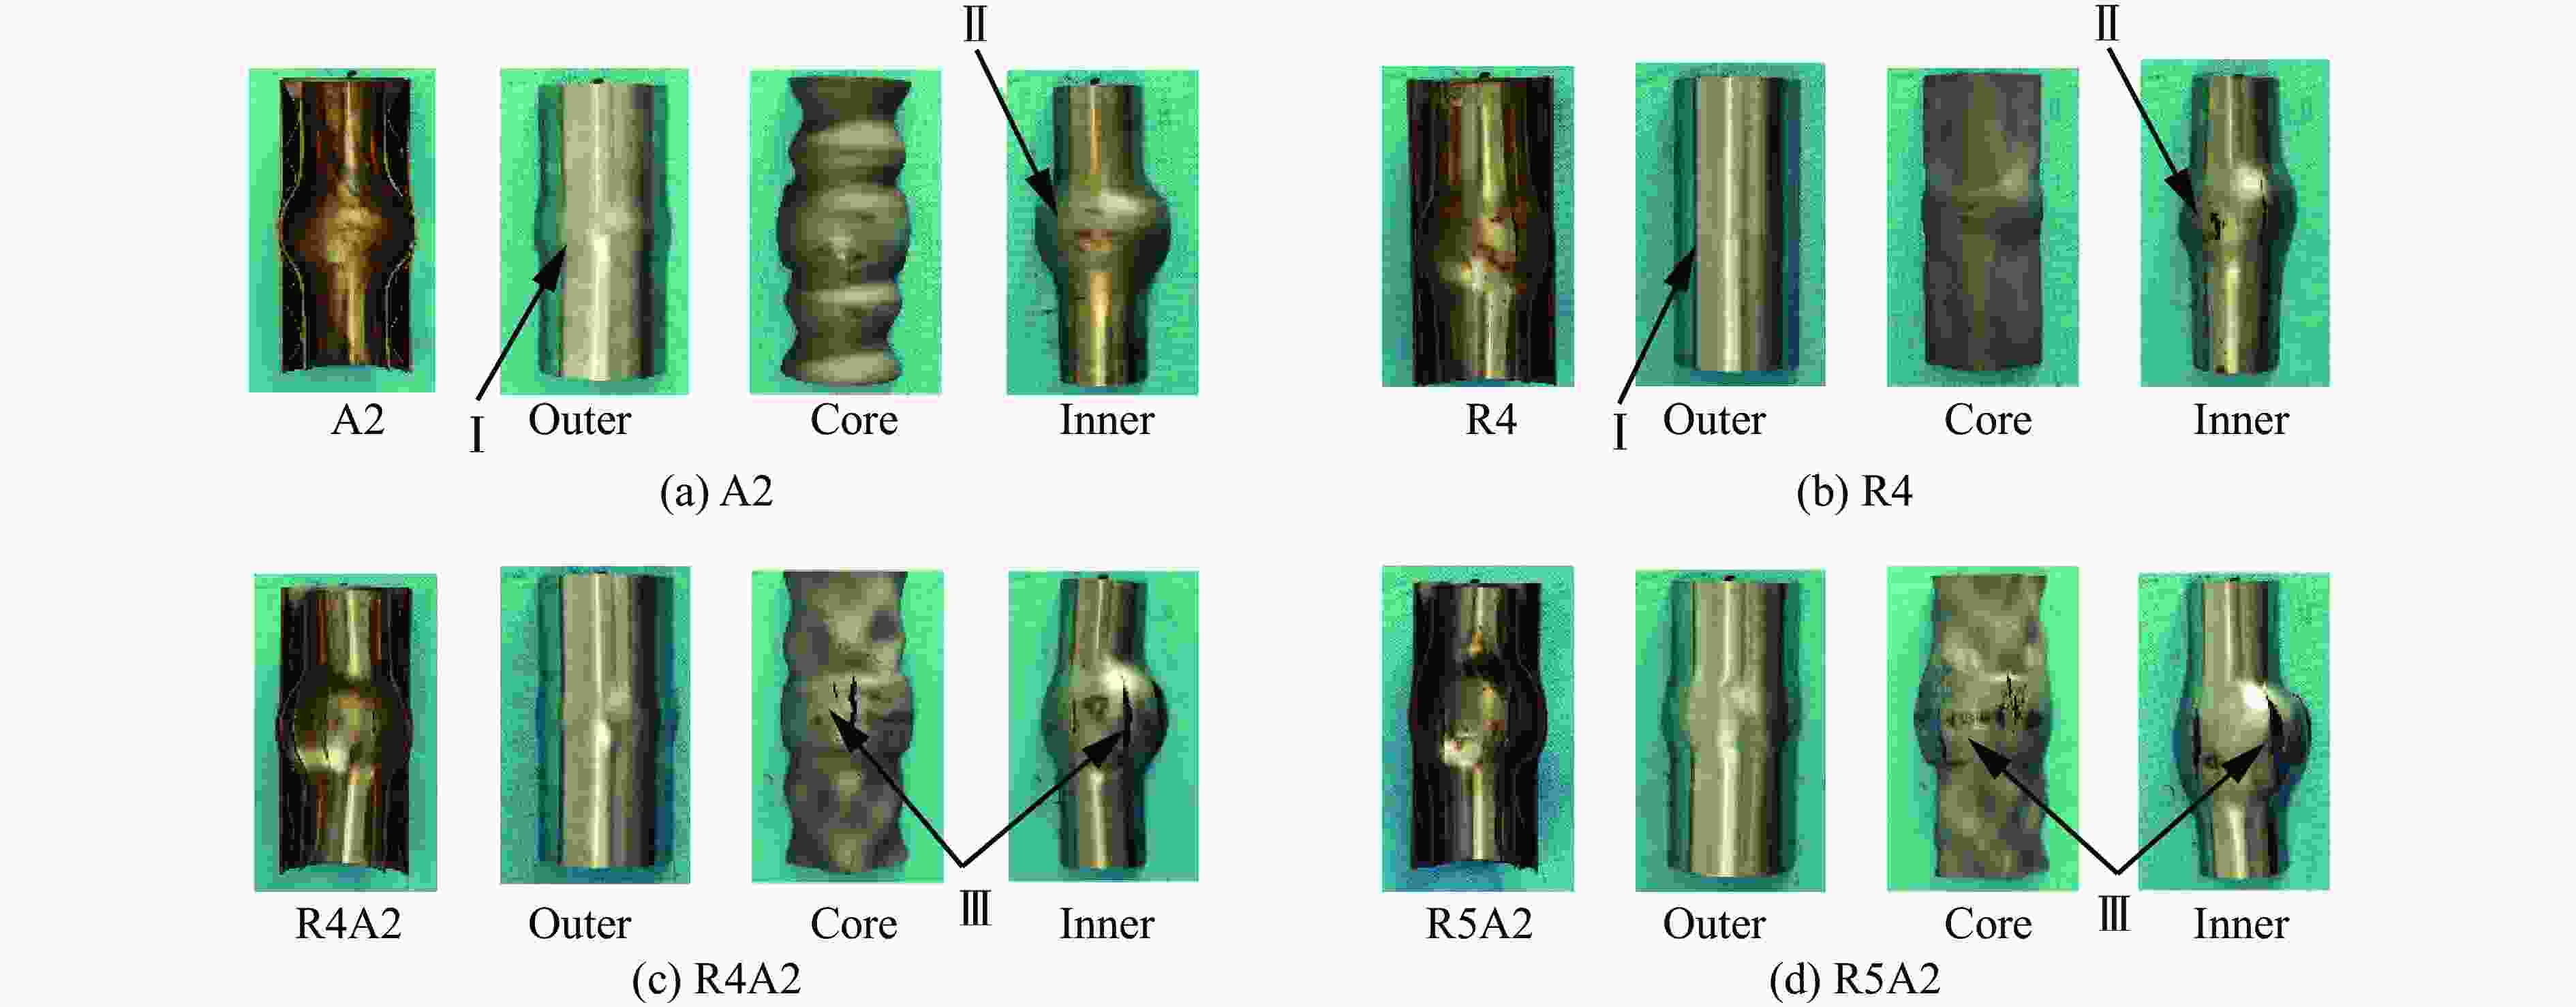
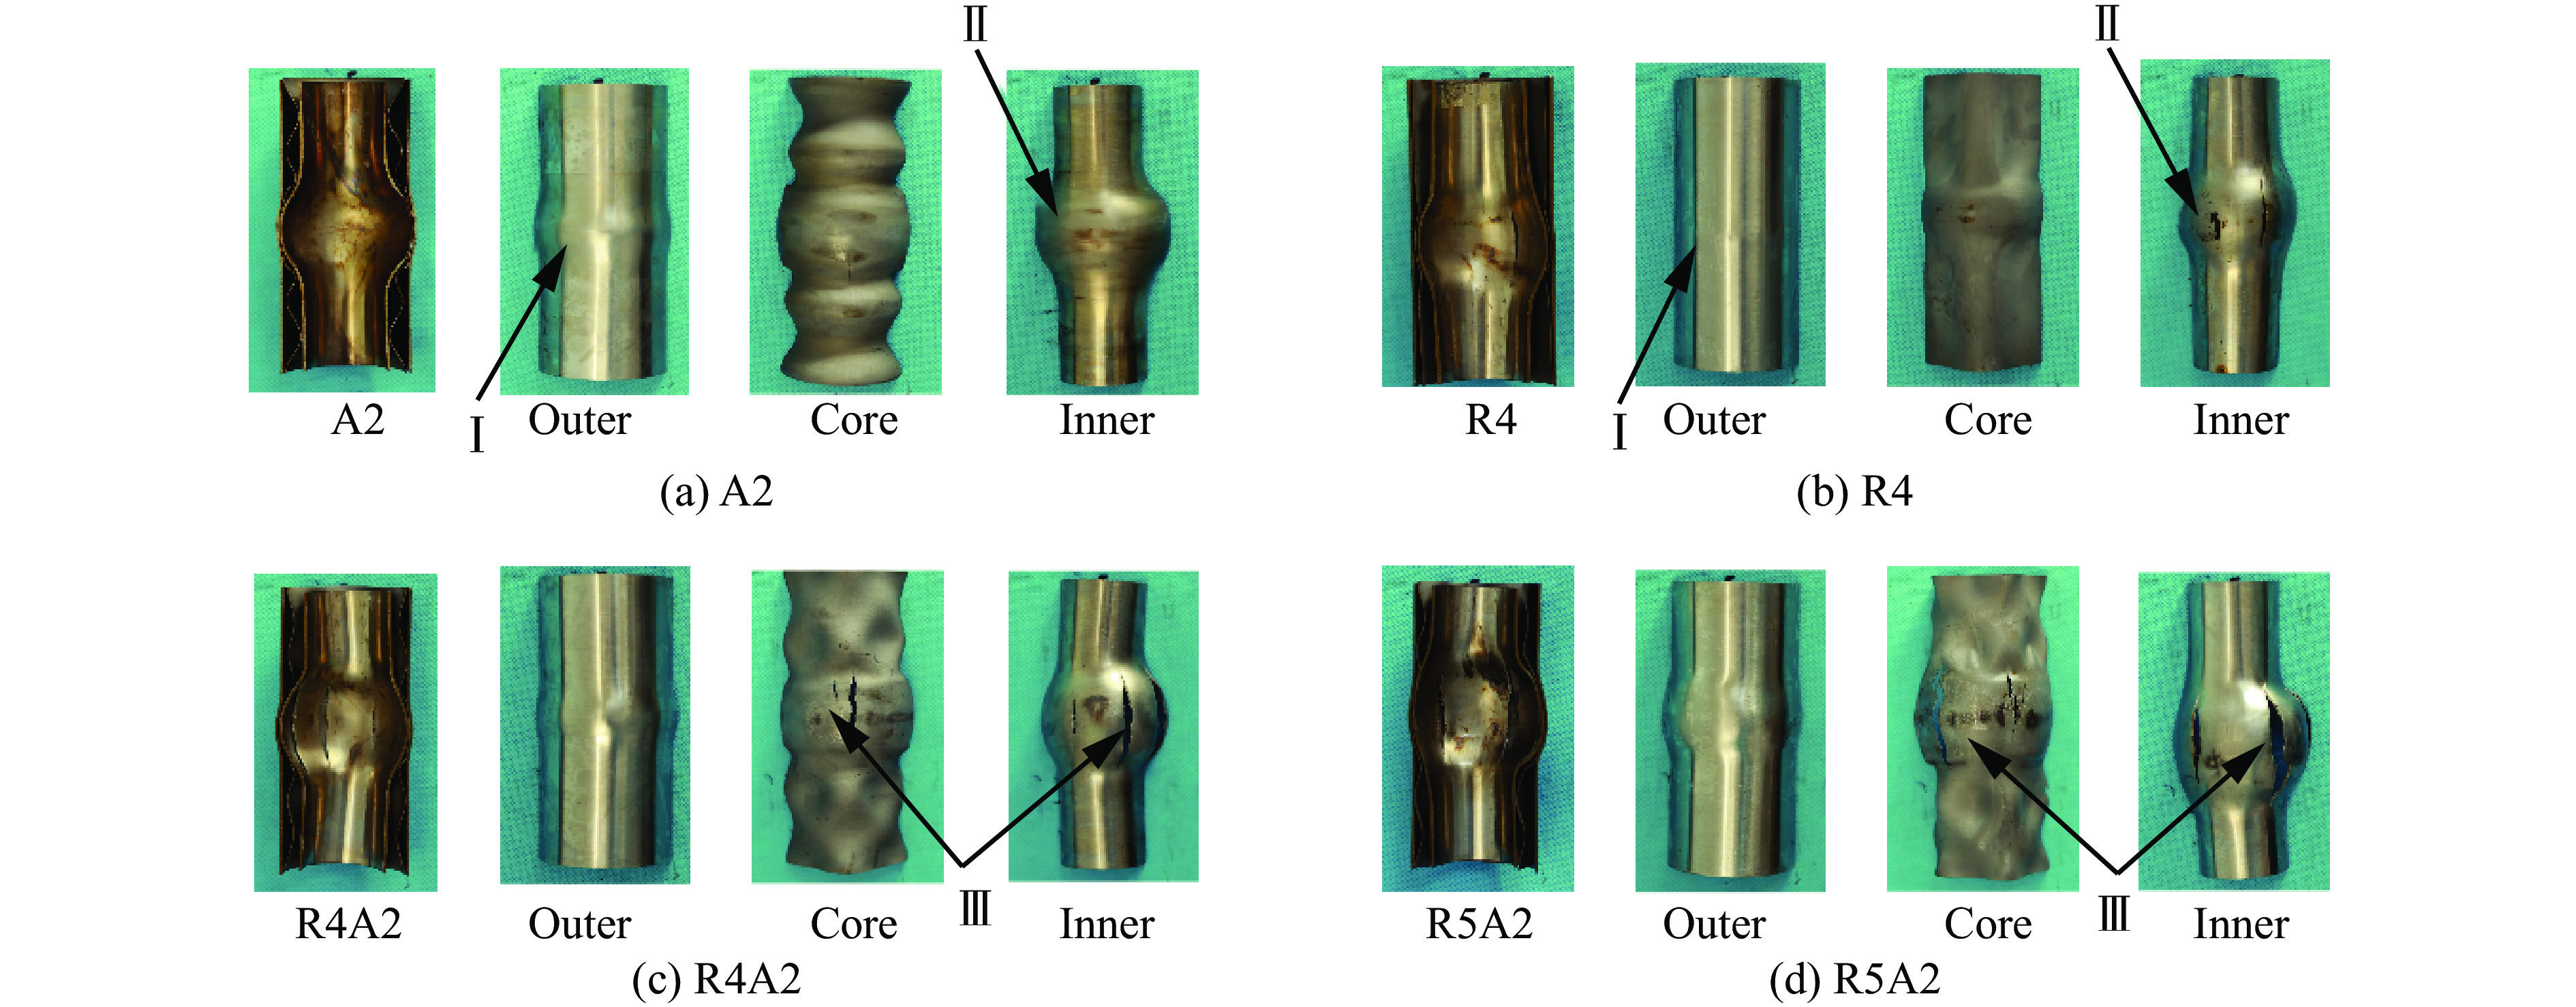
图 5 内部爆炸载荷下双向波纹夹芯管的实验结果
Figure 5. Experimental results of bi-directionally corrugated sandwich tubes under inner blast loading
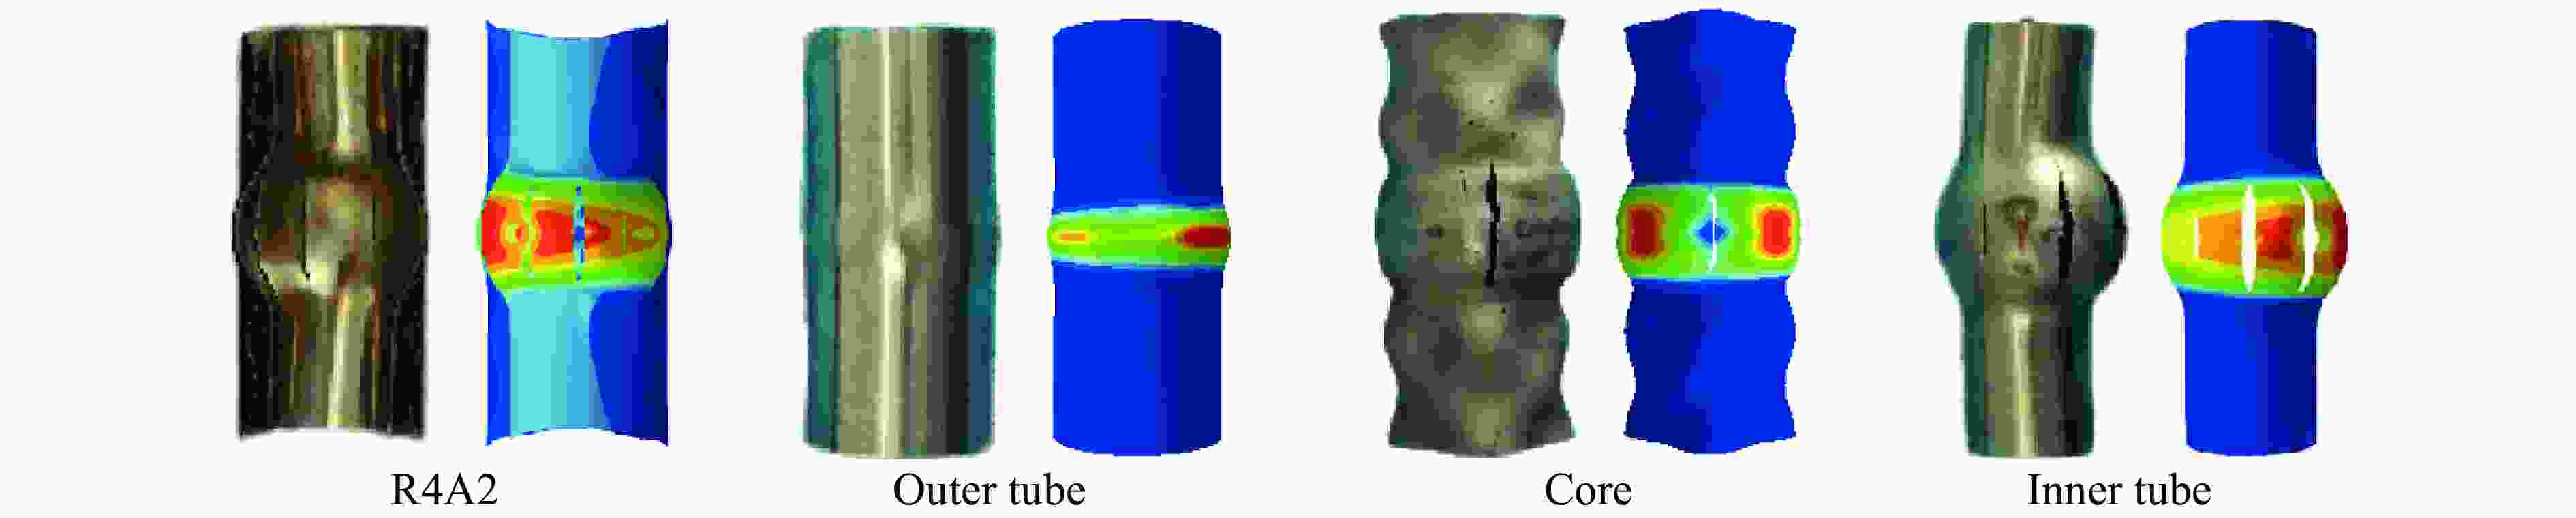
图 7 R4A2试件的数值模拟与实验变形模态对比
Figure 7. Comparison of the deformation modes between the simulation and experimental results of R4A2
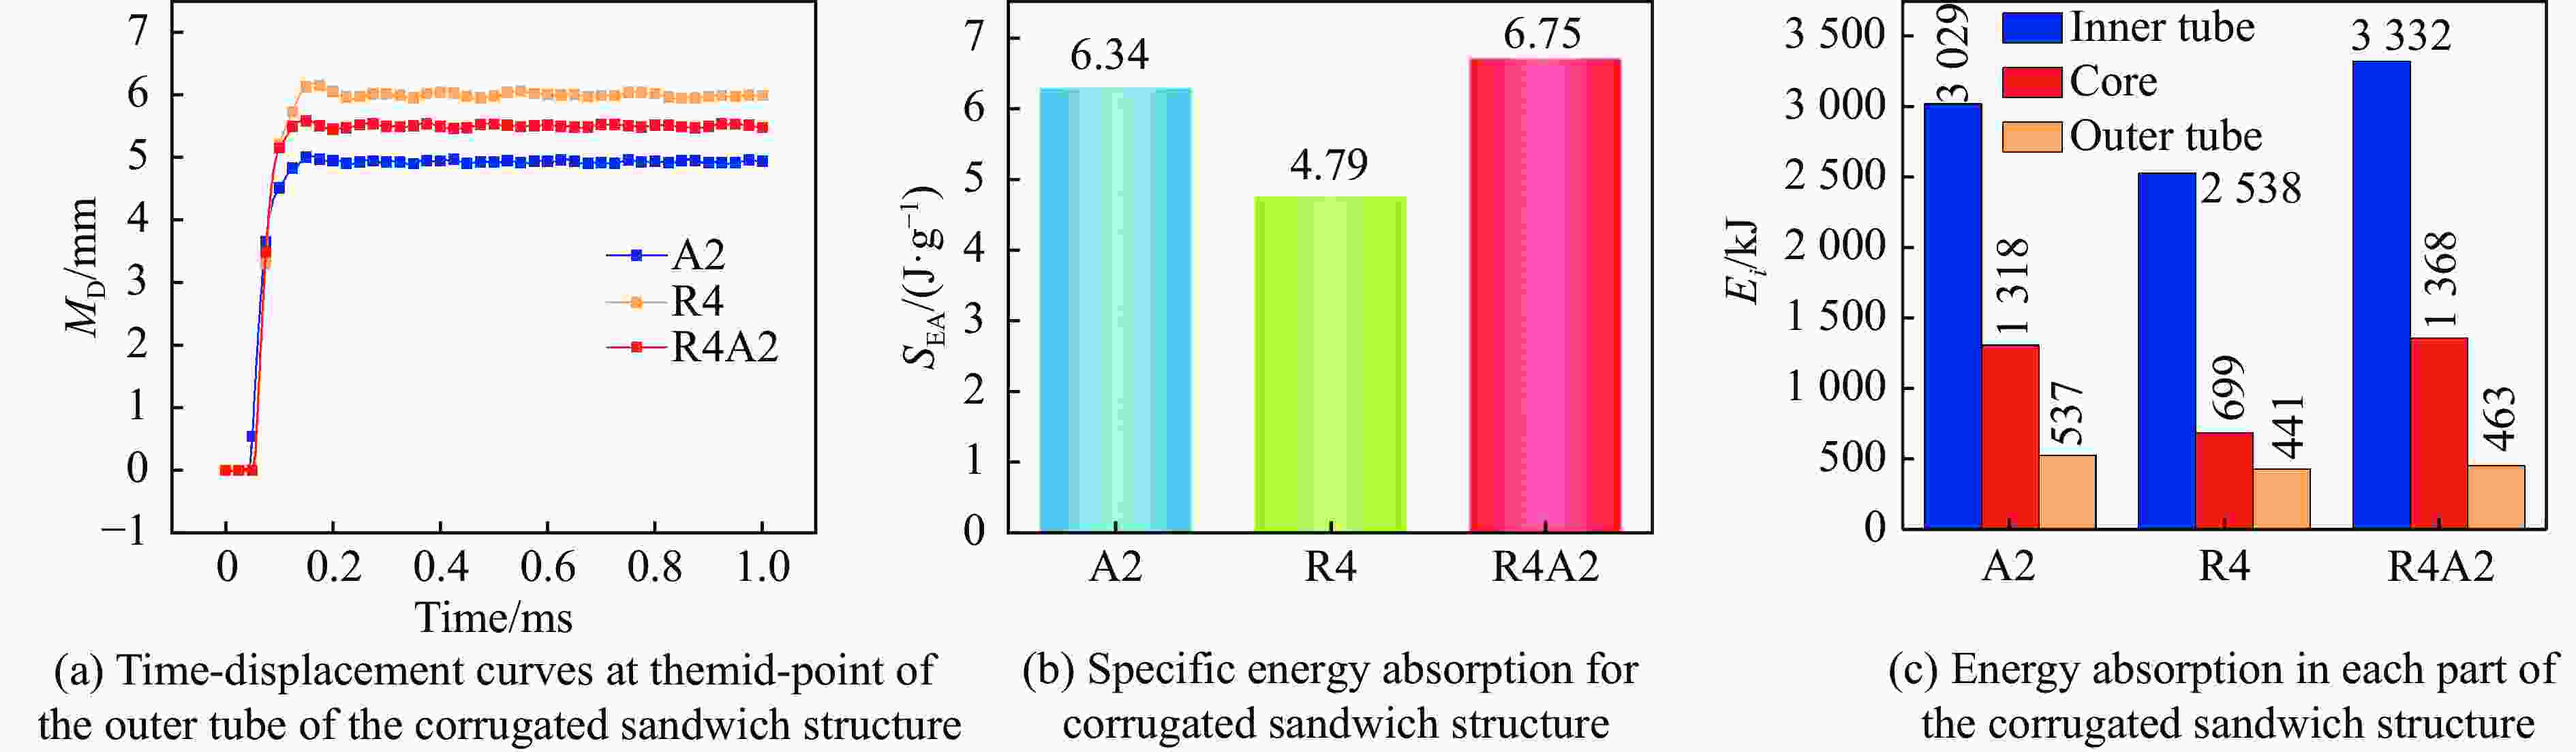
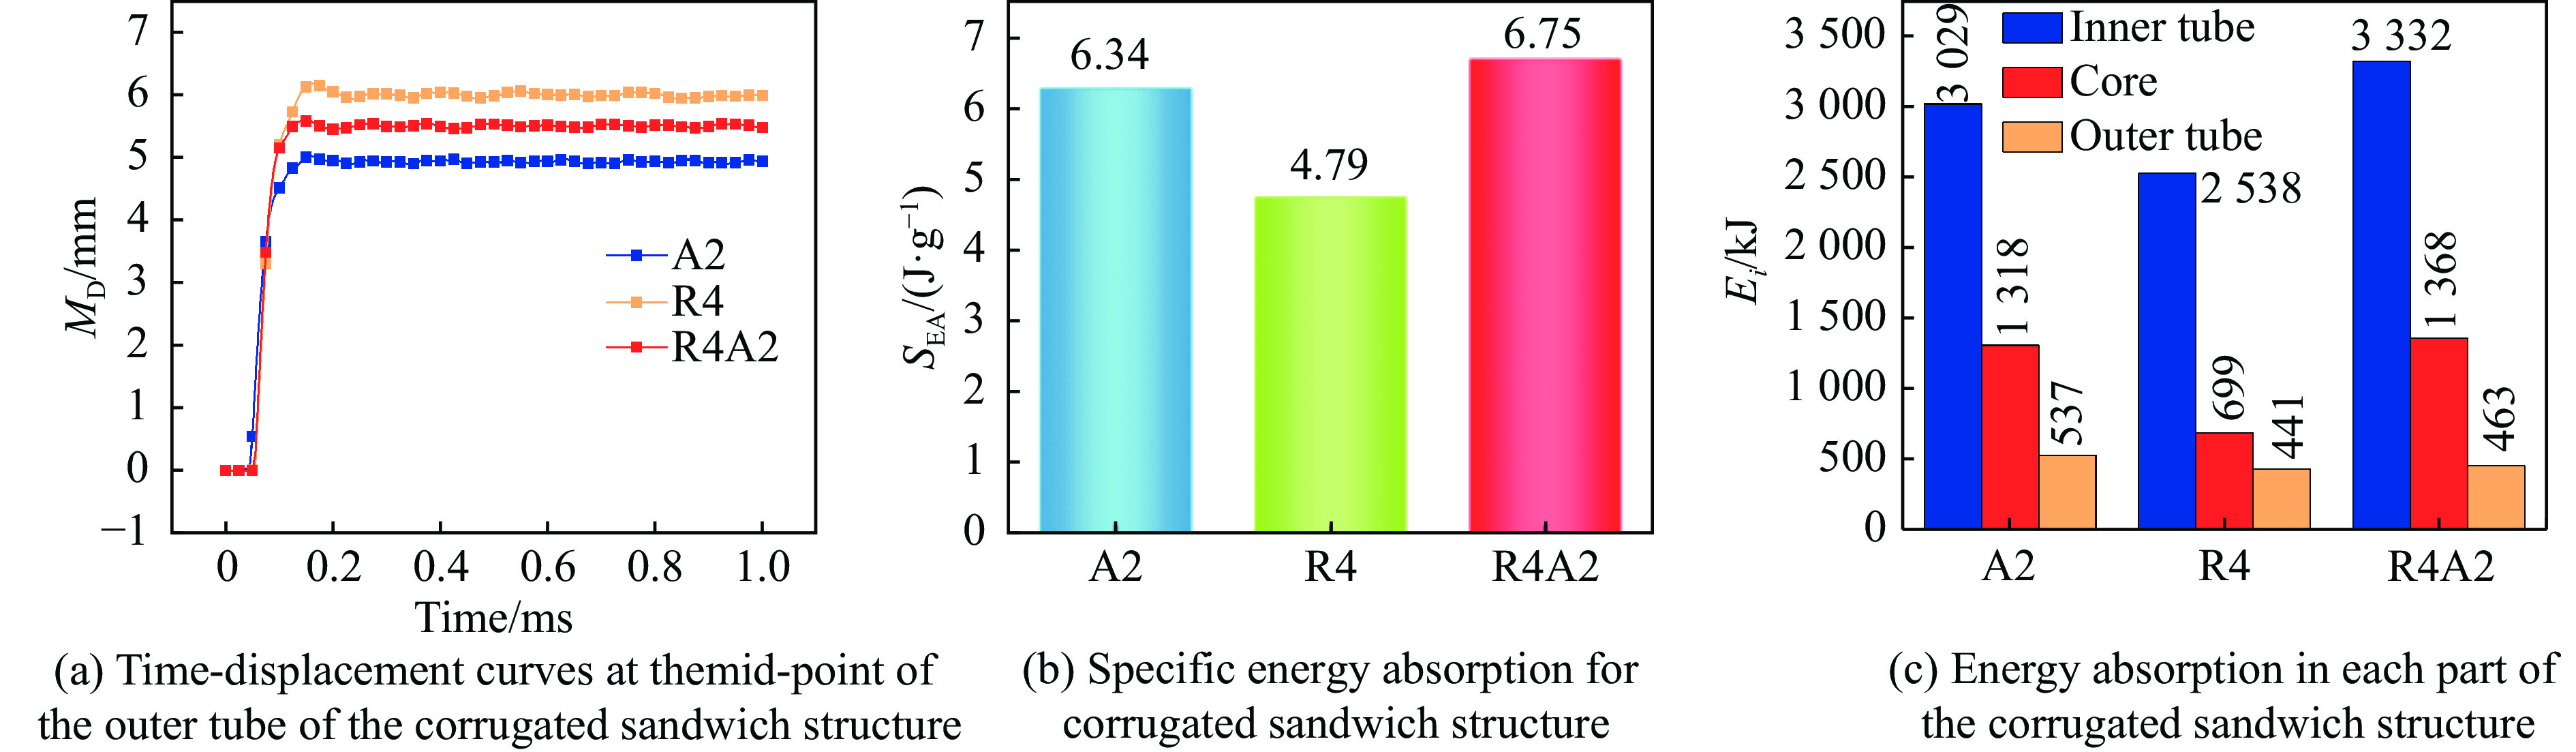
图 8 不同波纹夹芯管的抗爆性能对比
Figure 8. Comparison of the blast resistance for different corrugated sandwich tubes
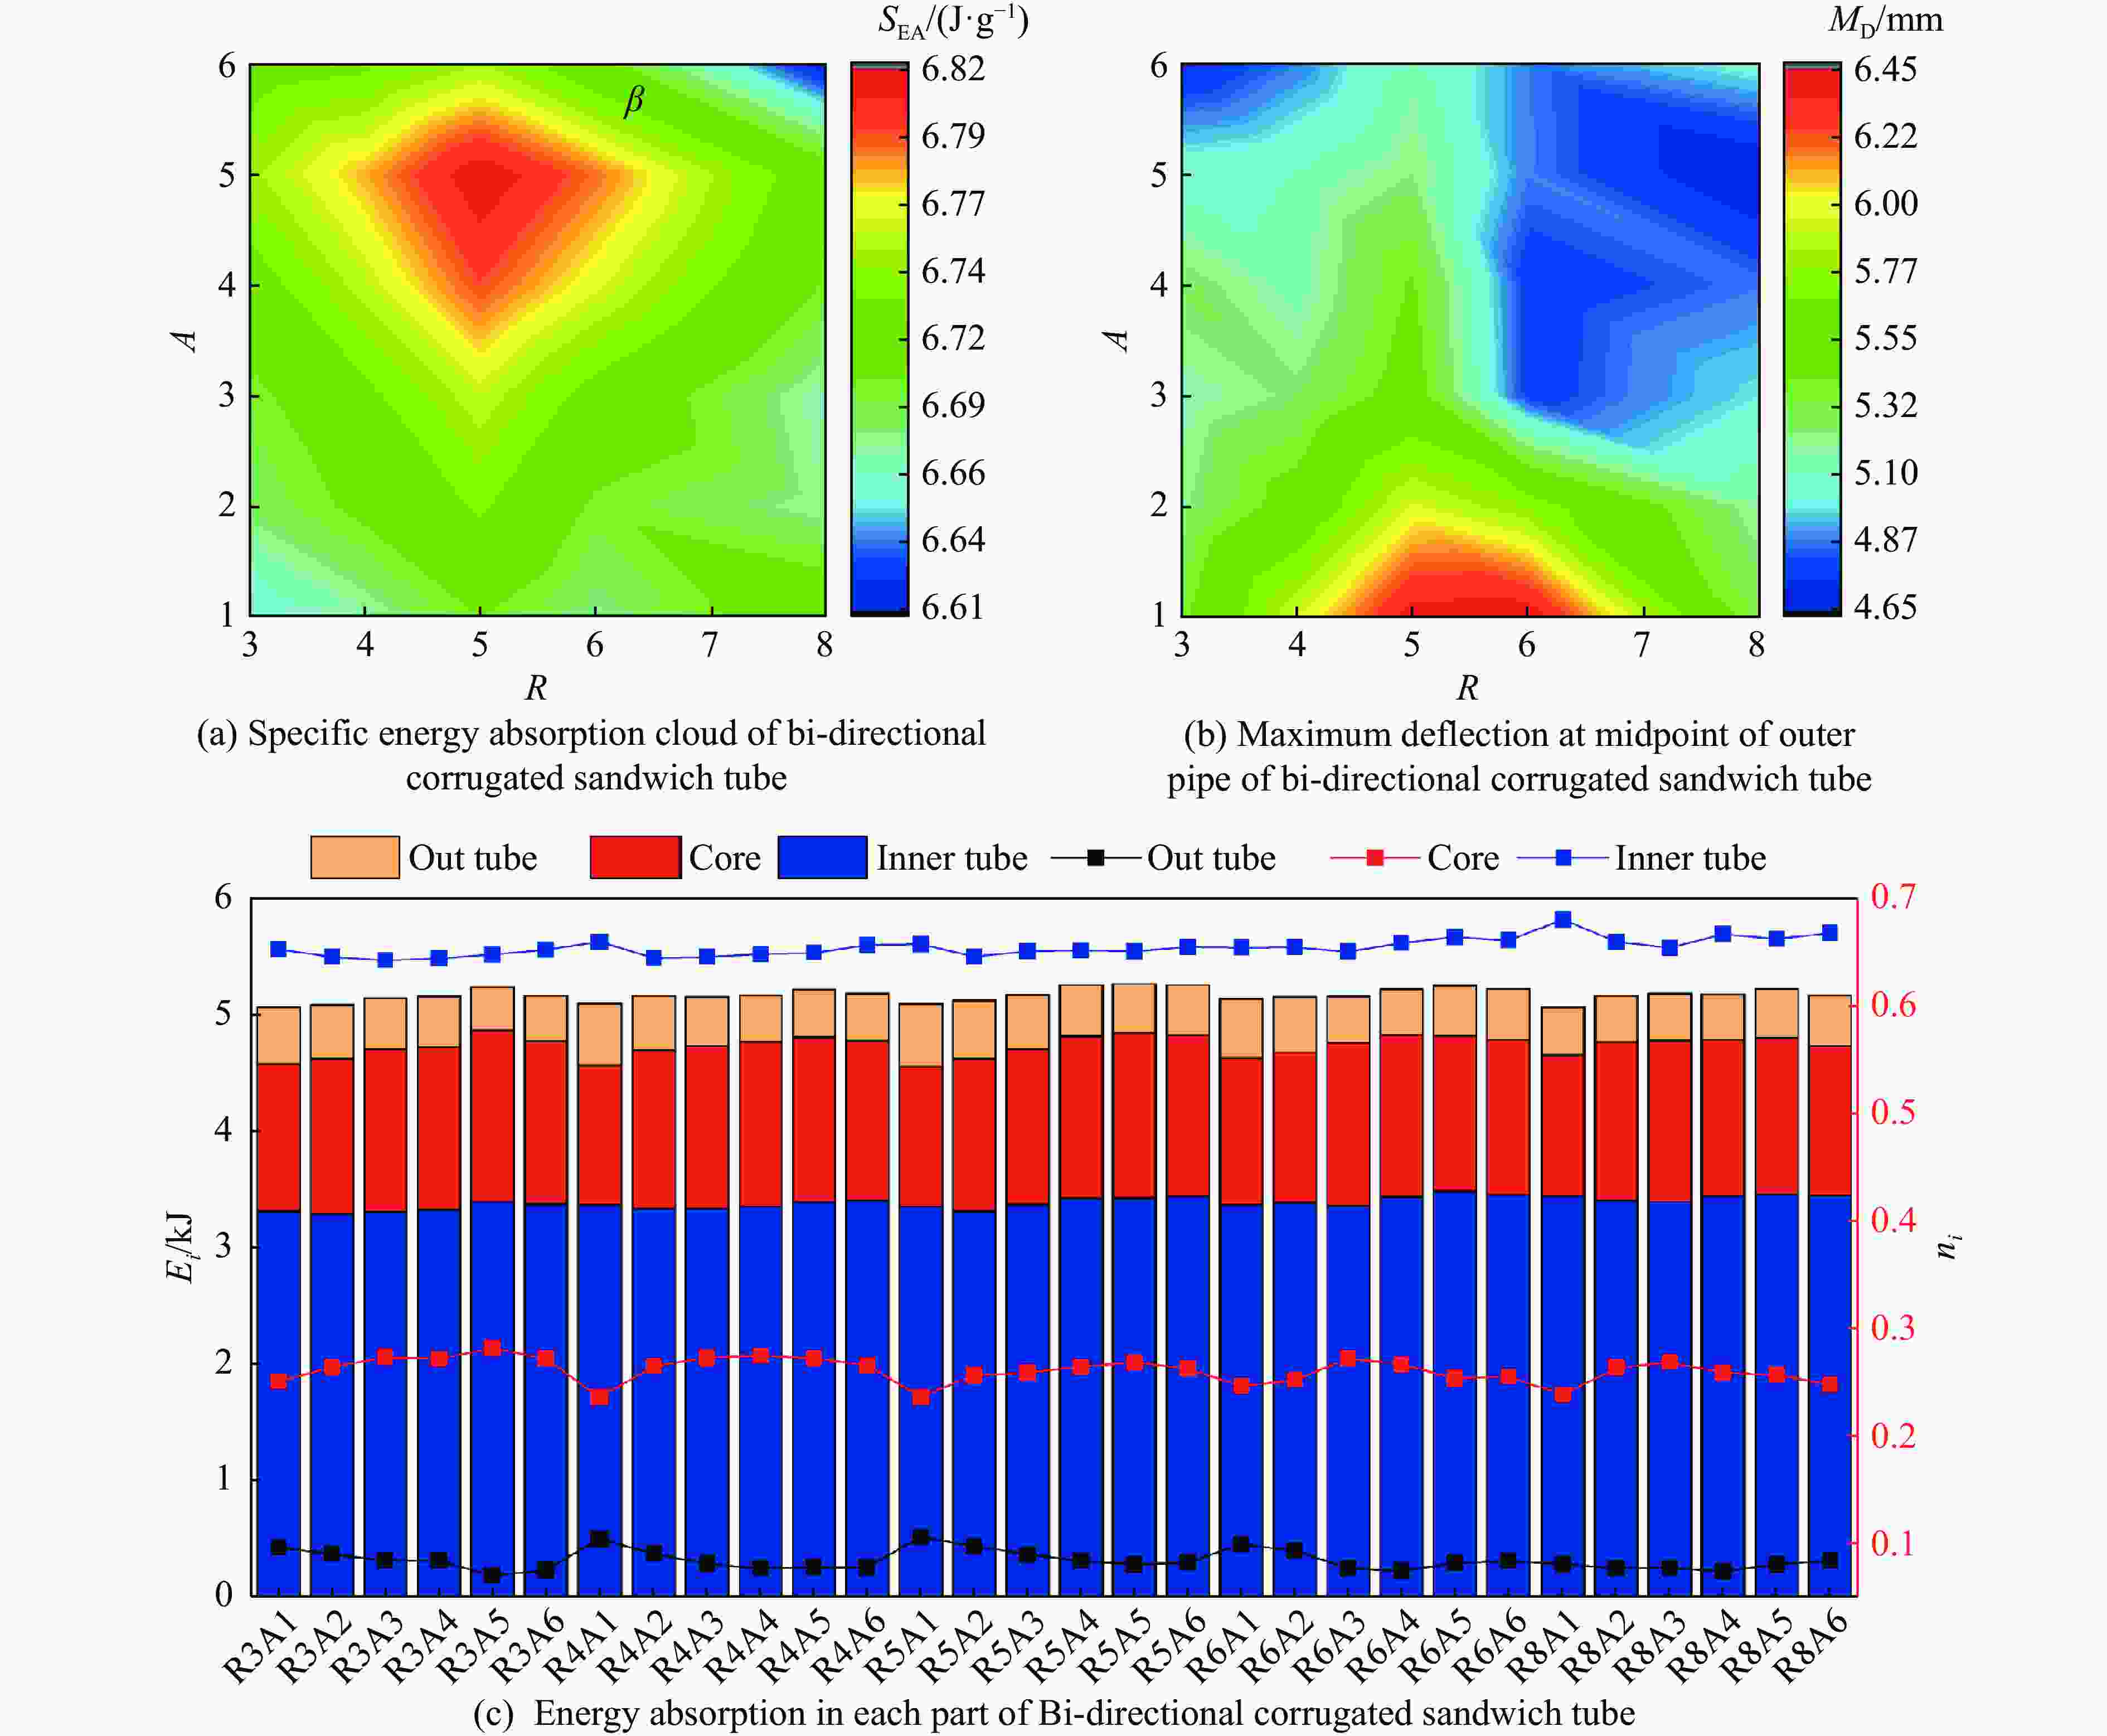
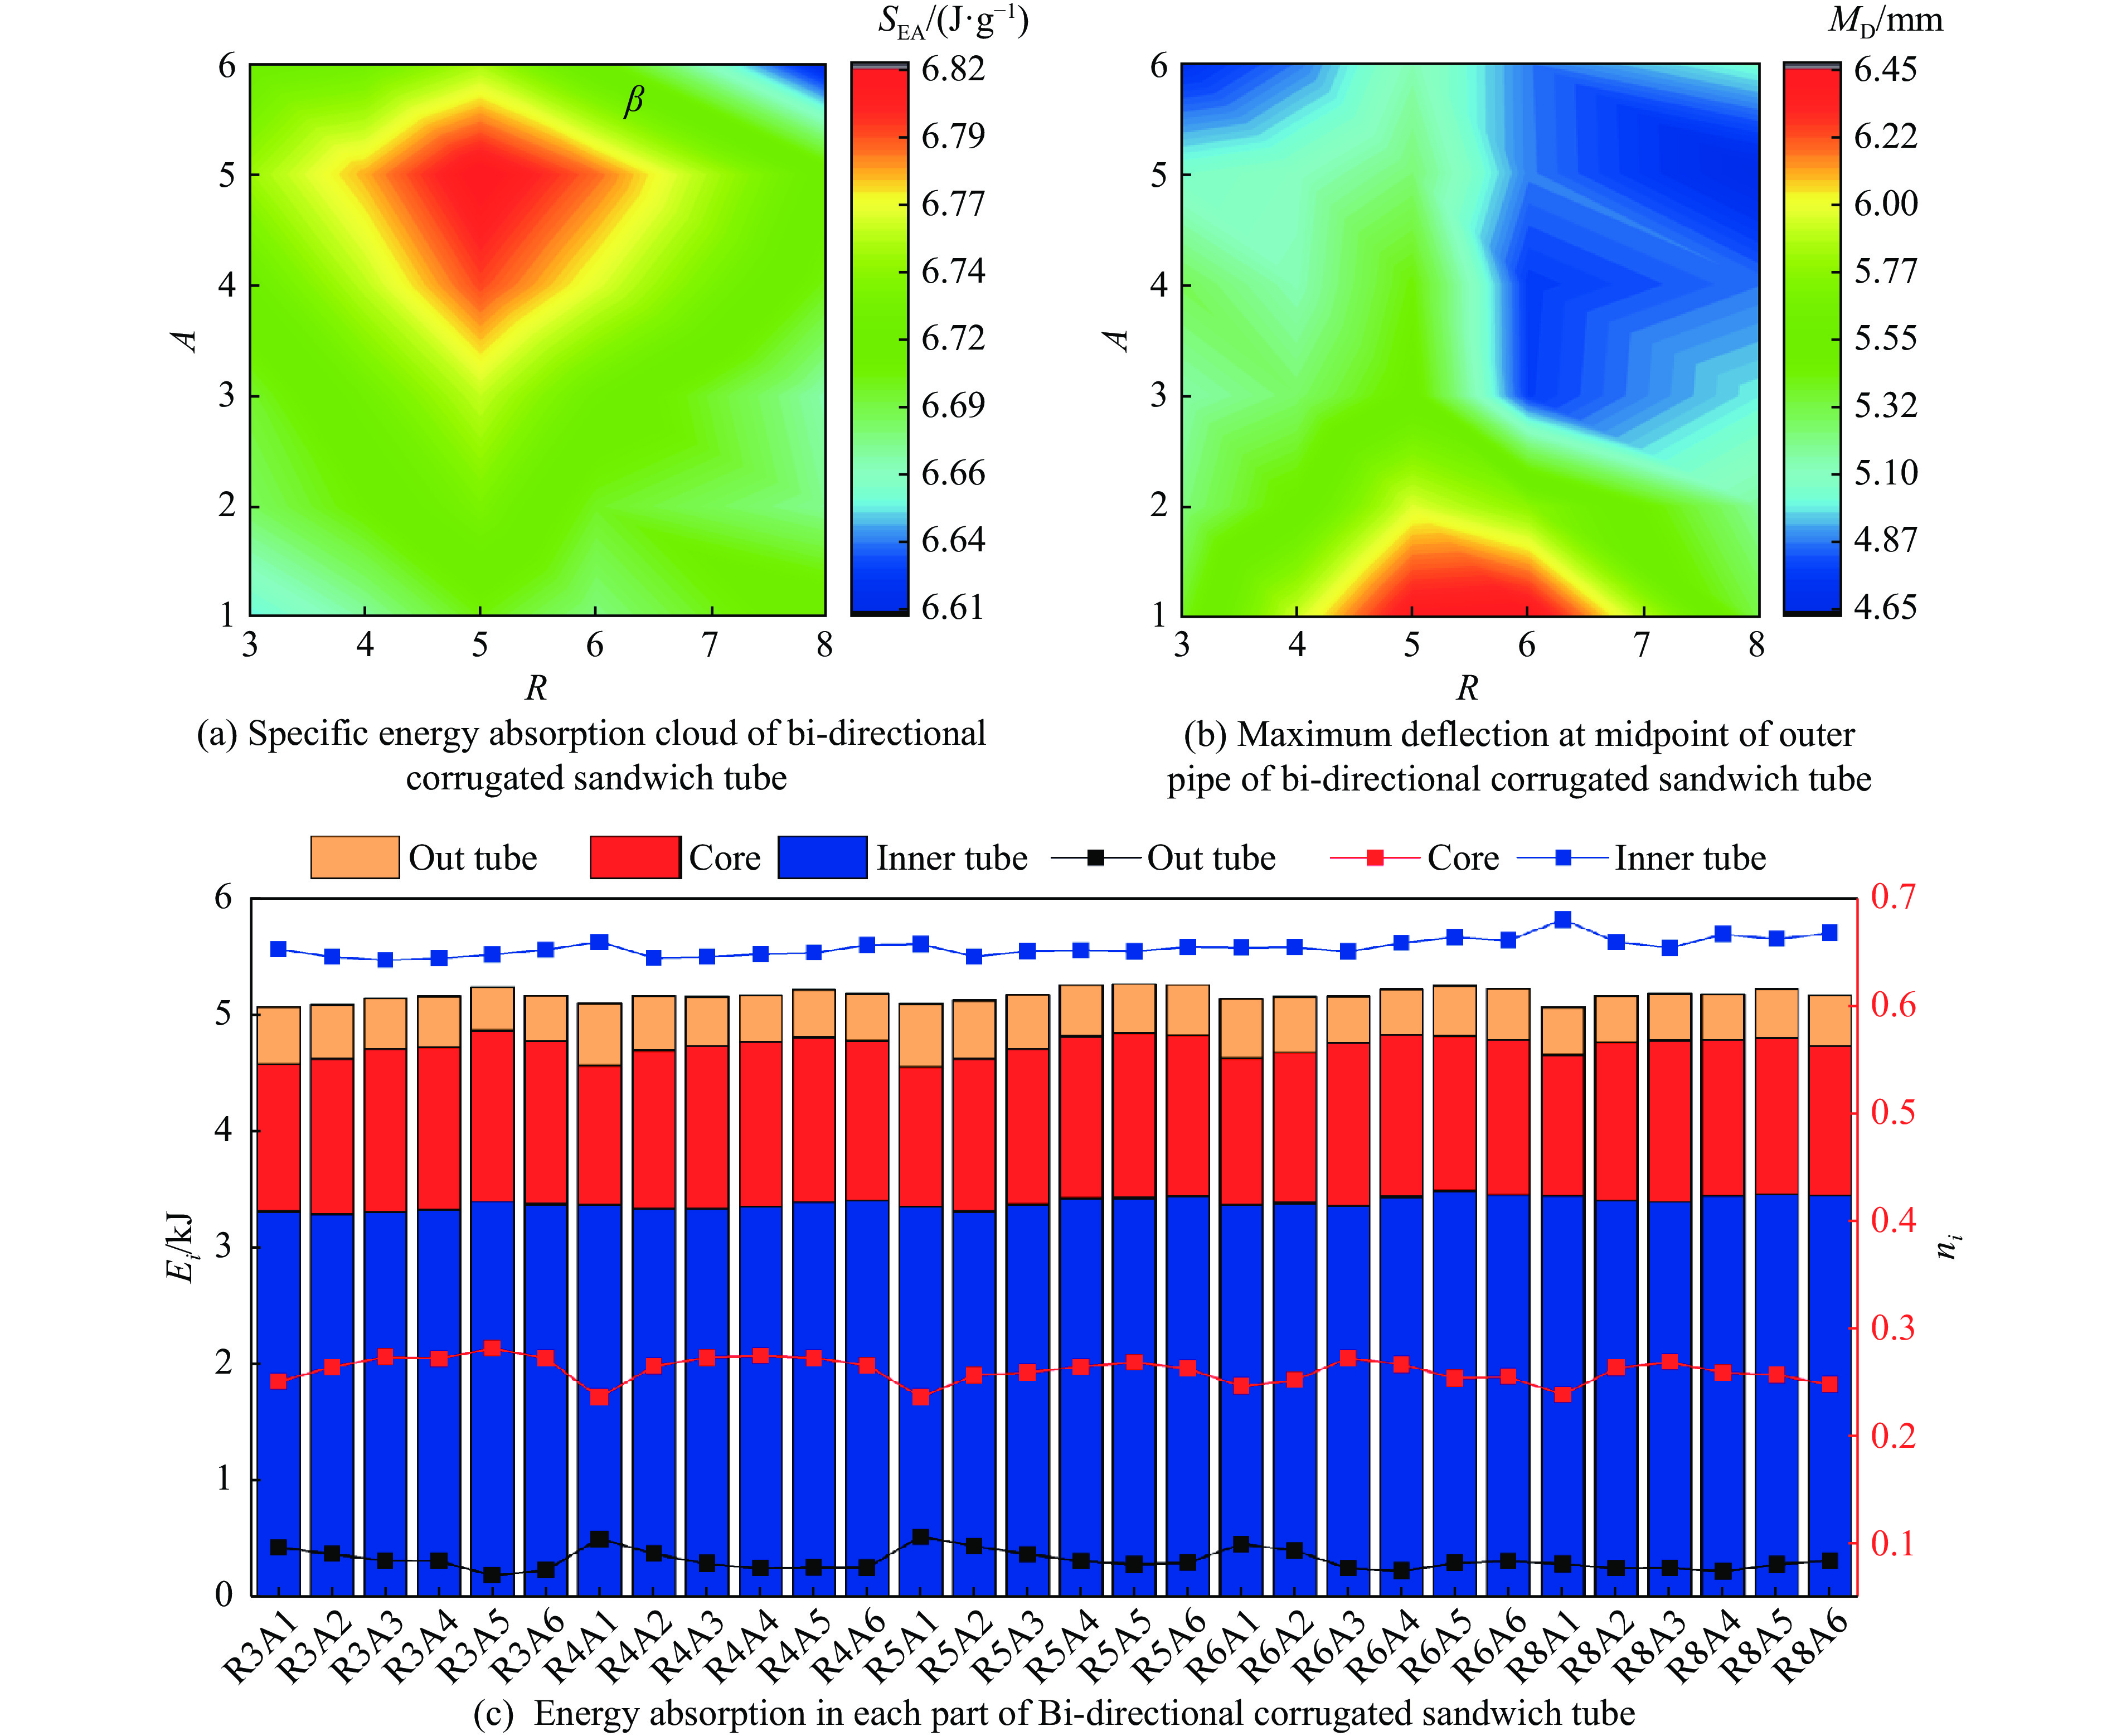
图 9 不同波纹数的双向波纹夹芯管的抗爆性能
Figure 9. Blast resistance of bi-directional corrugated sandwich tubes with different corrugation numbers

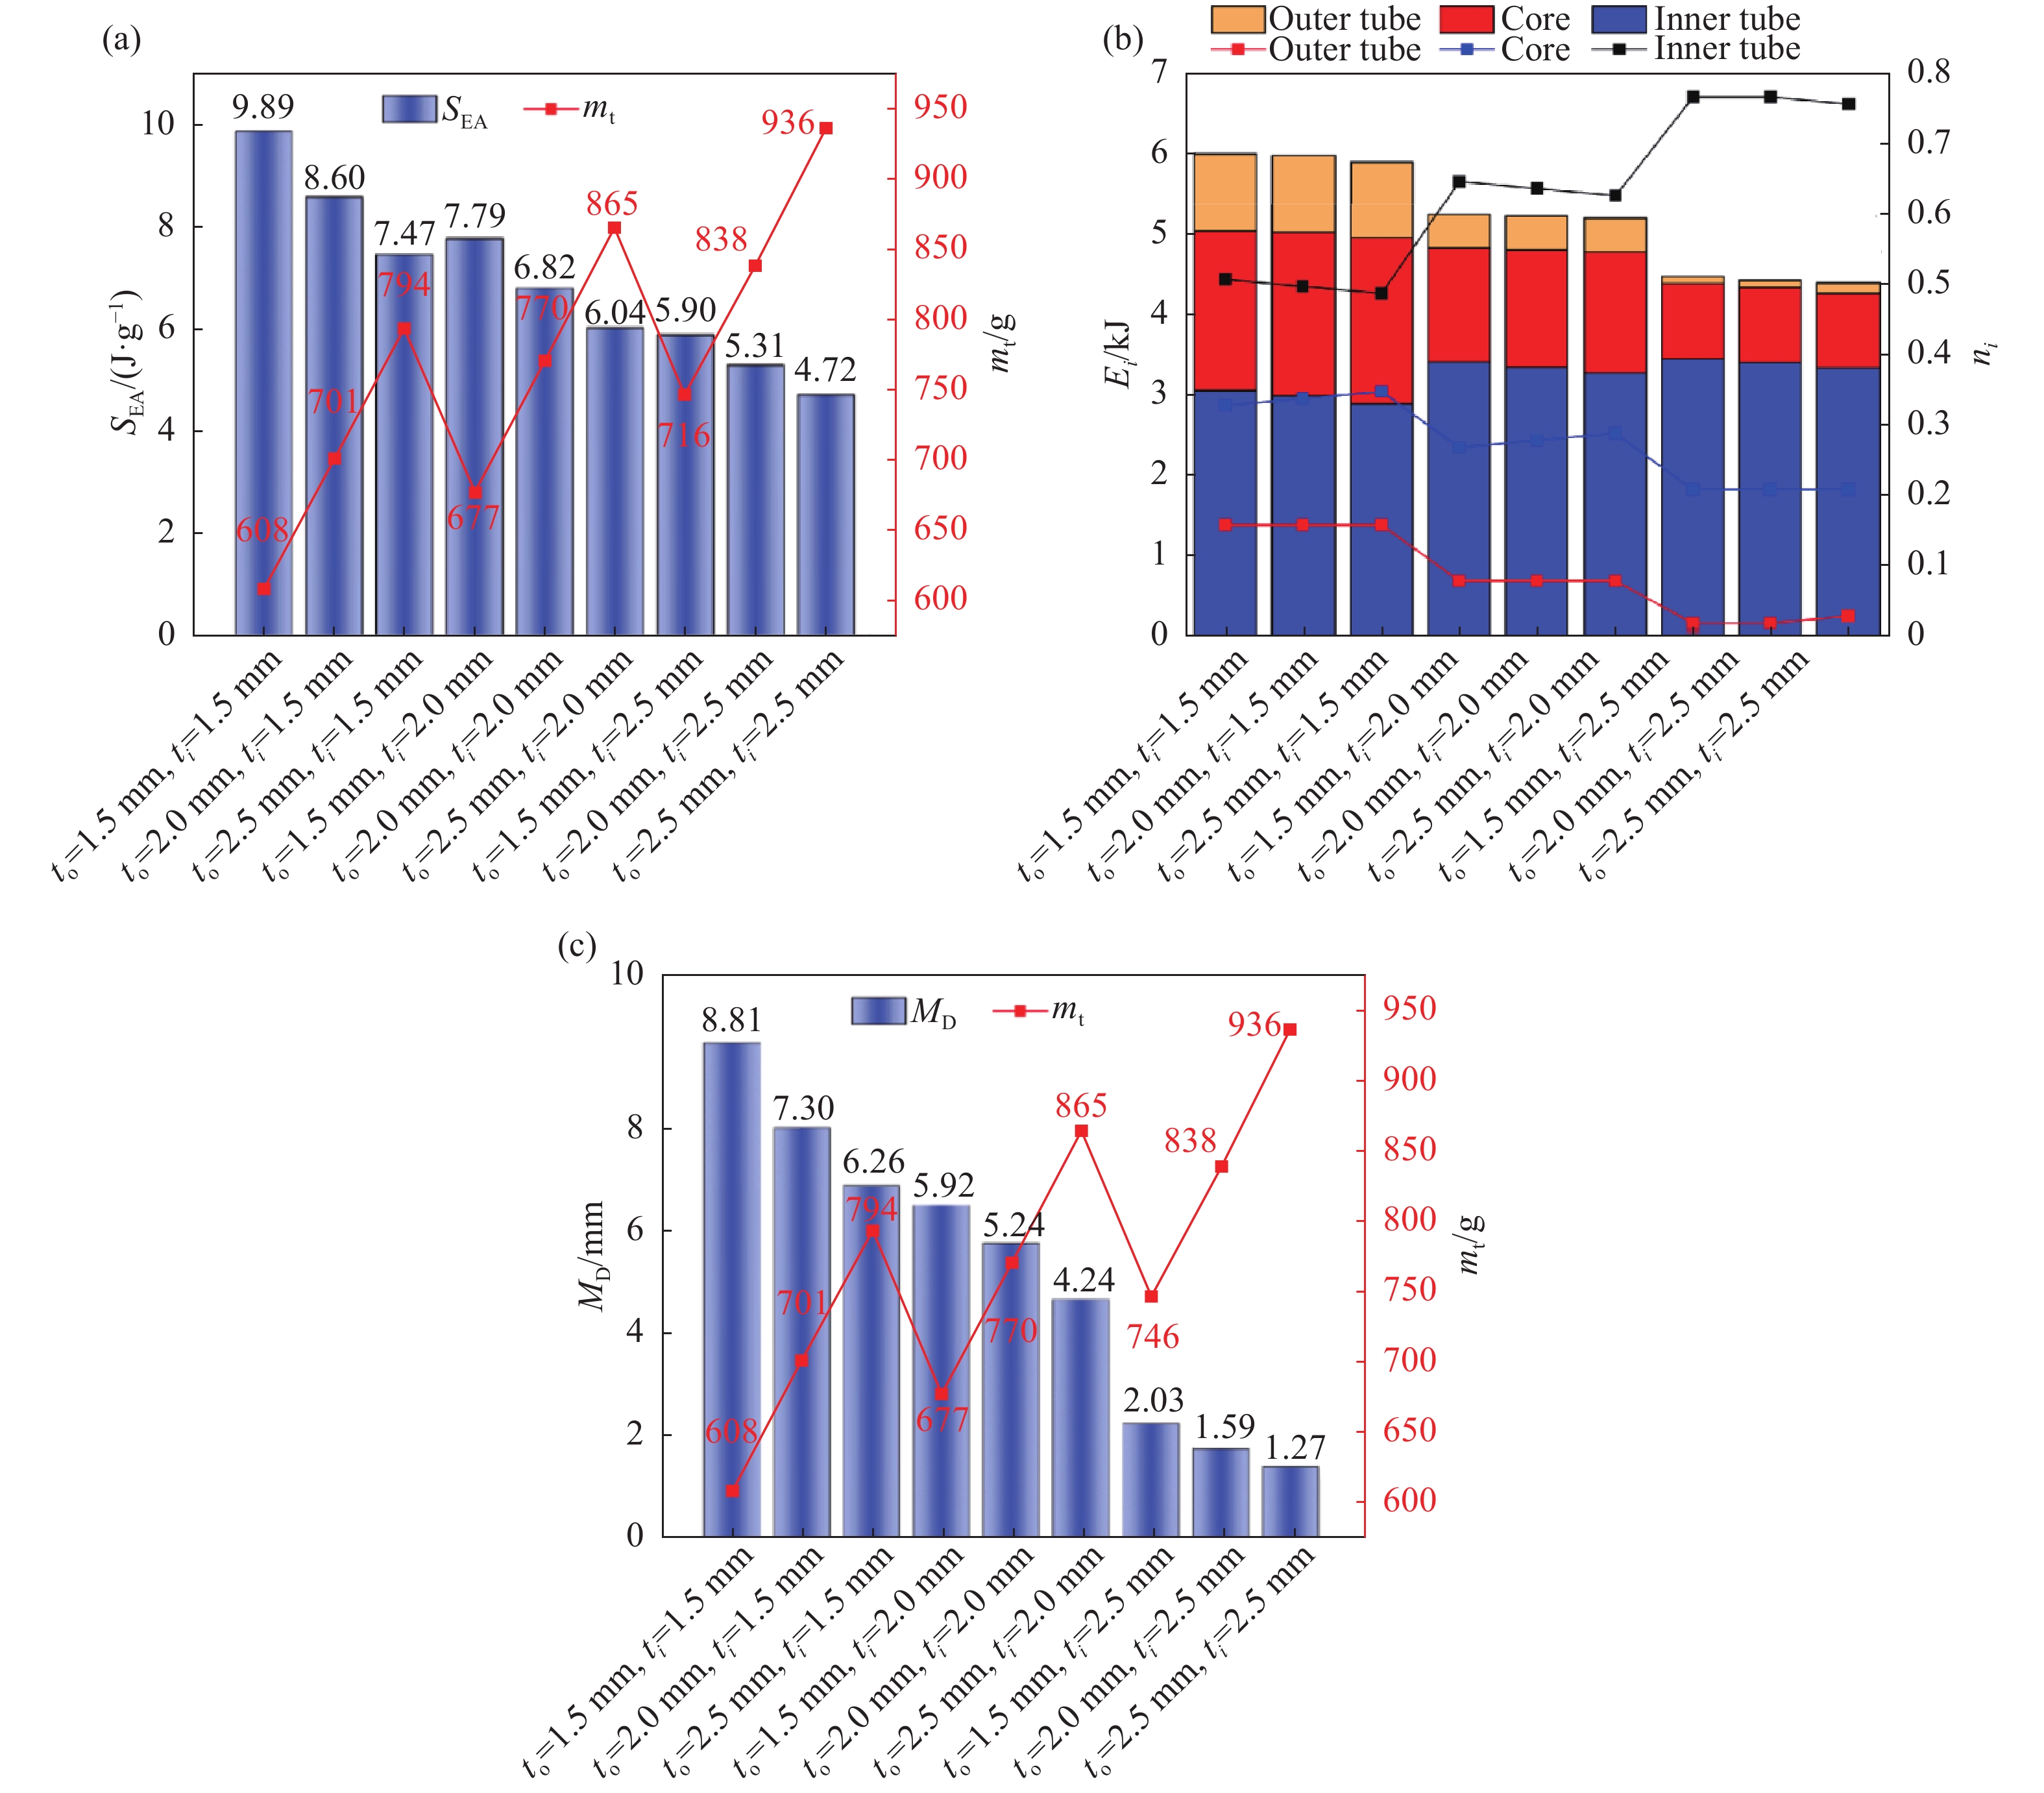
图 10 不同内外管厚度下R5A5结构的抗爆性能
Figure 10. Blast resistance of R5A5 structure with different thicknesses of inner and outer tubes
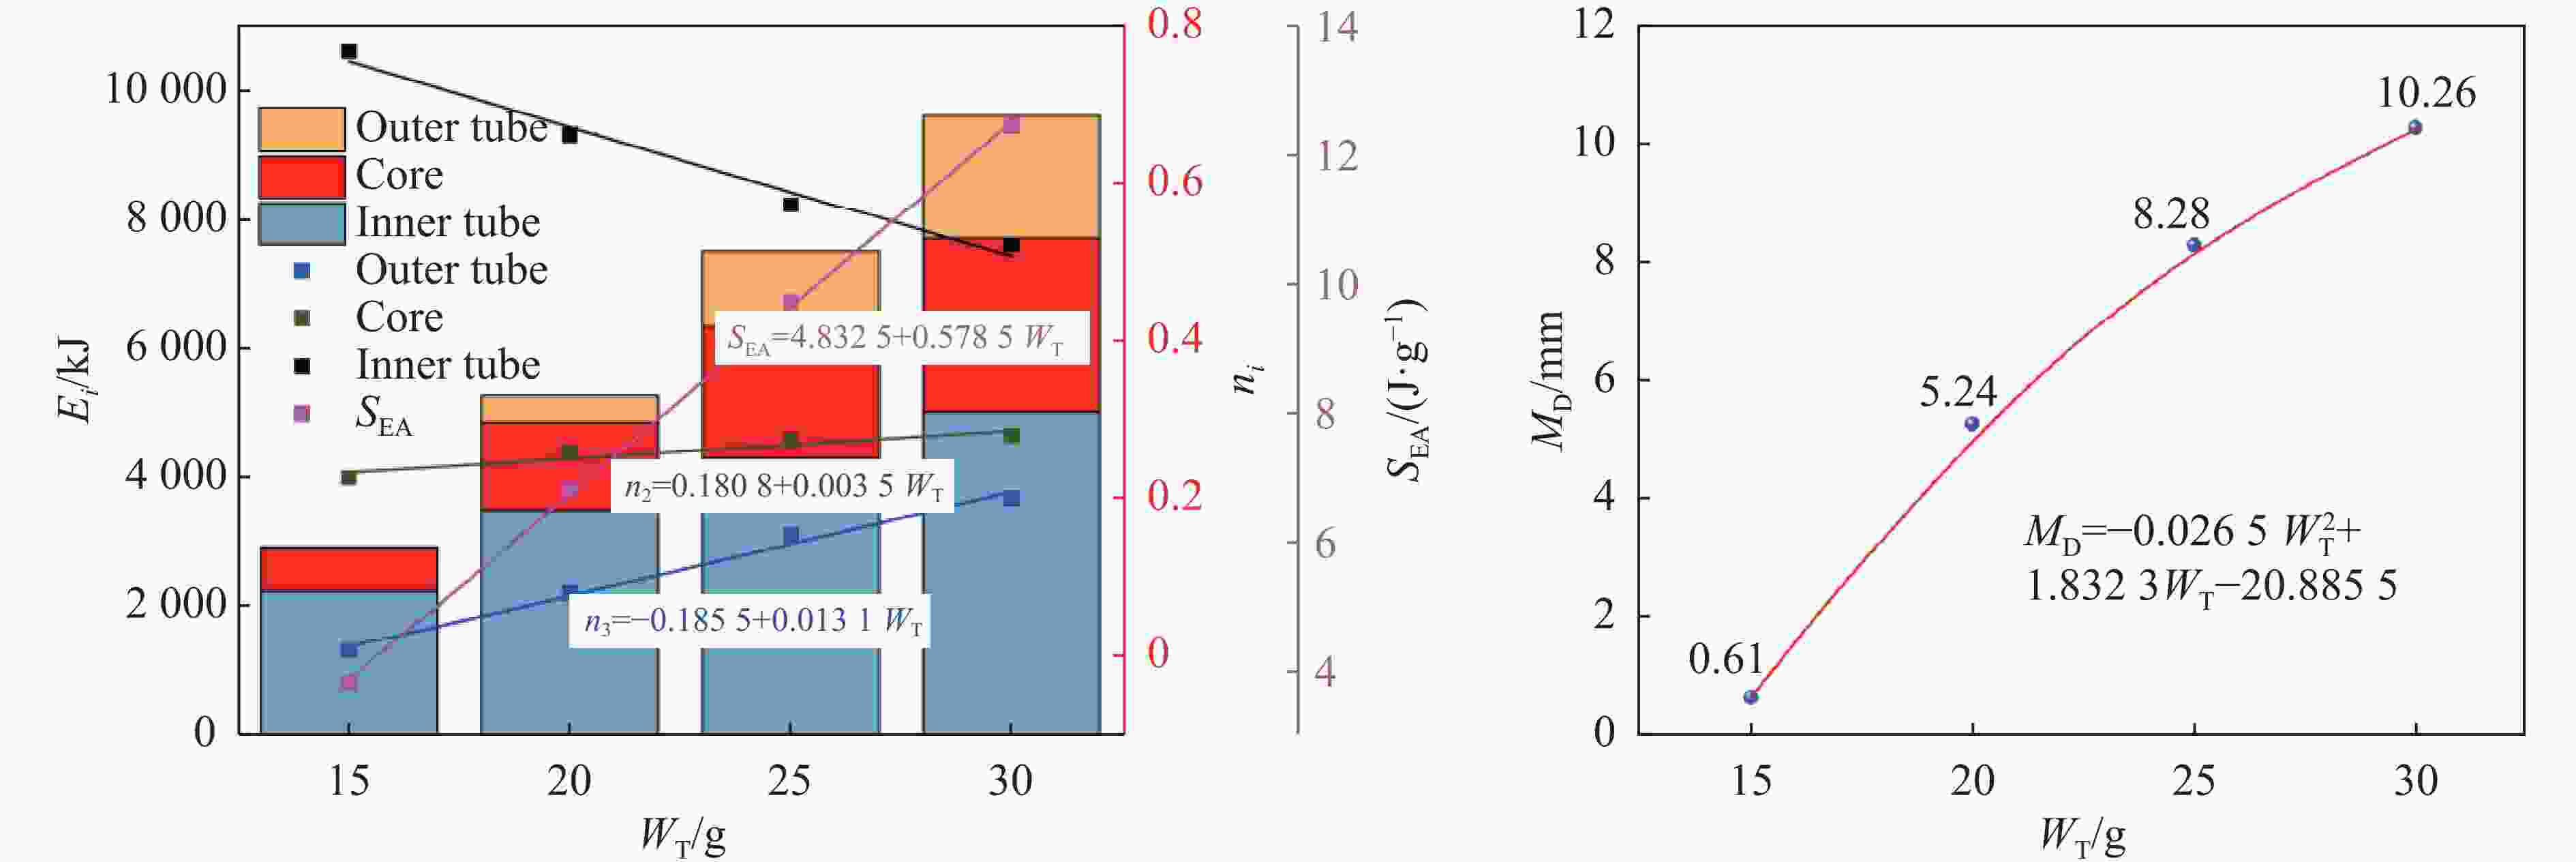
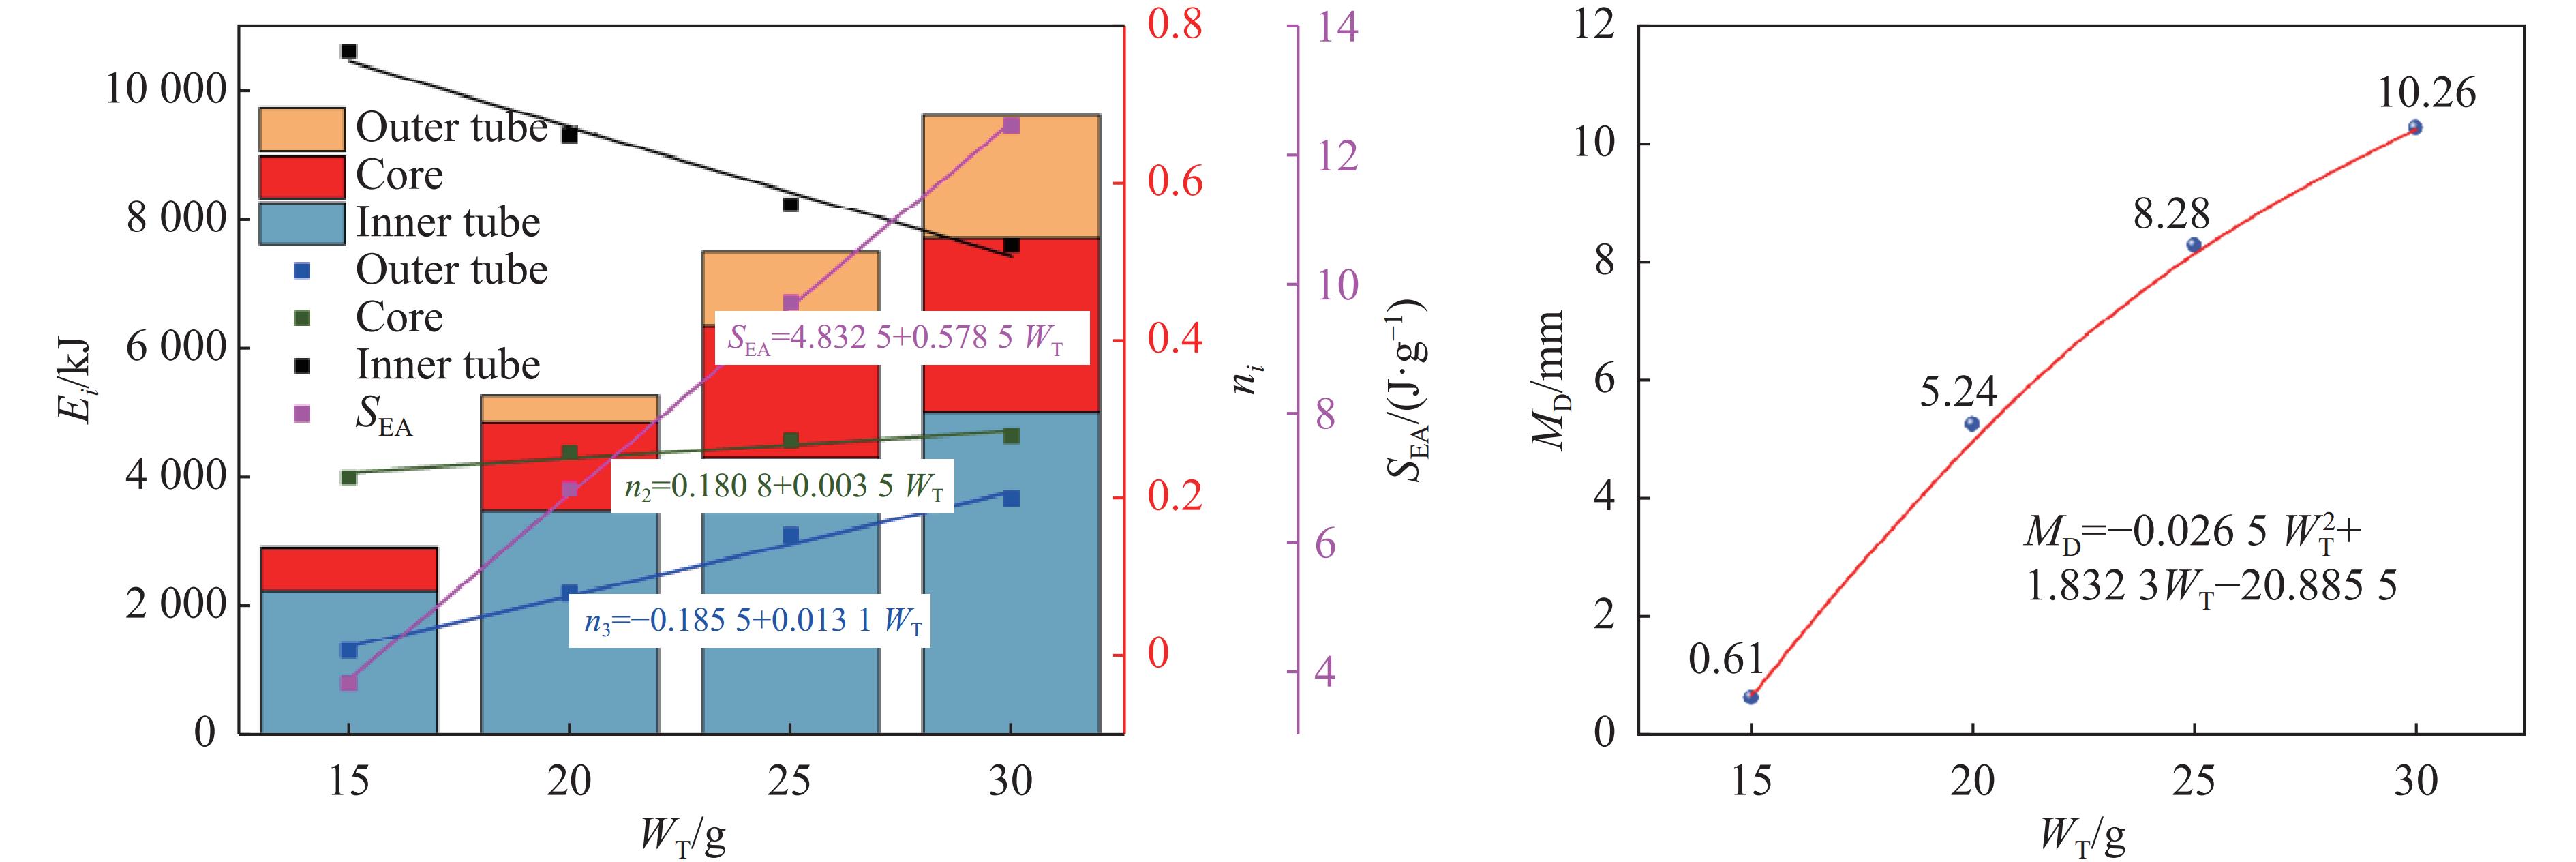
图 11 不同TNT当量下R5A5的抗爆性能
Figure 11. Blast resistance of R5A5 under different equivalent TNT dosage
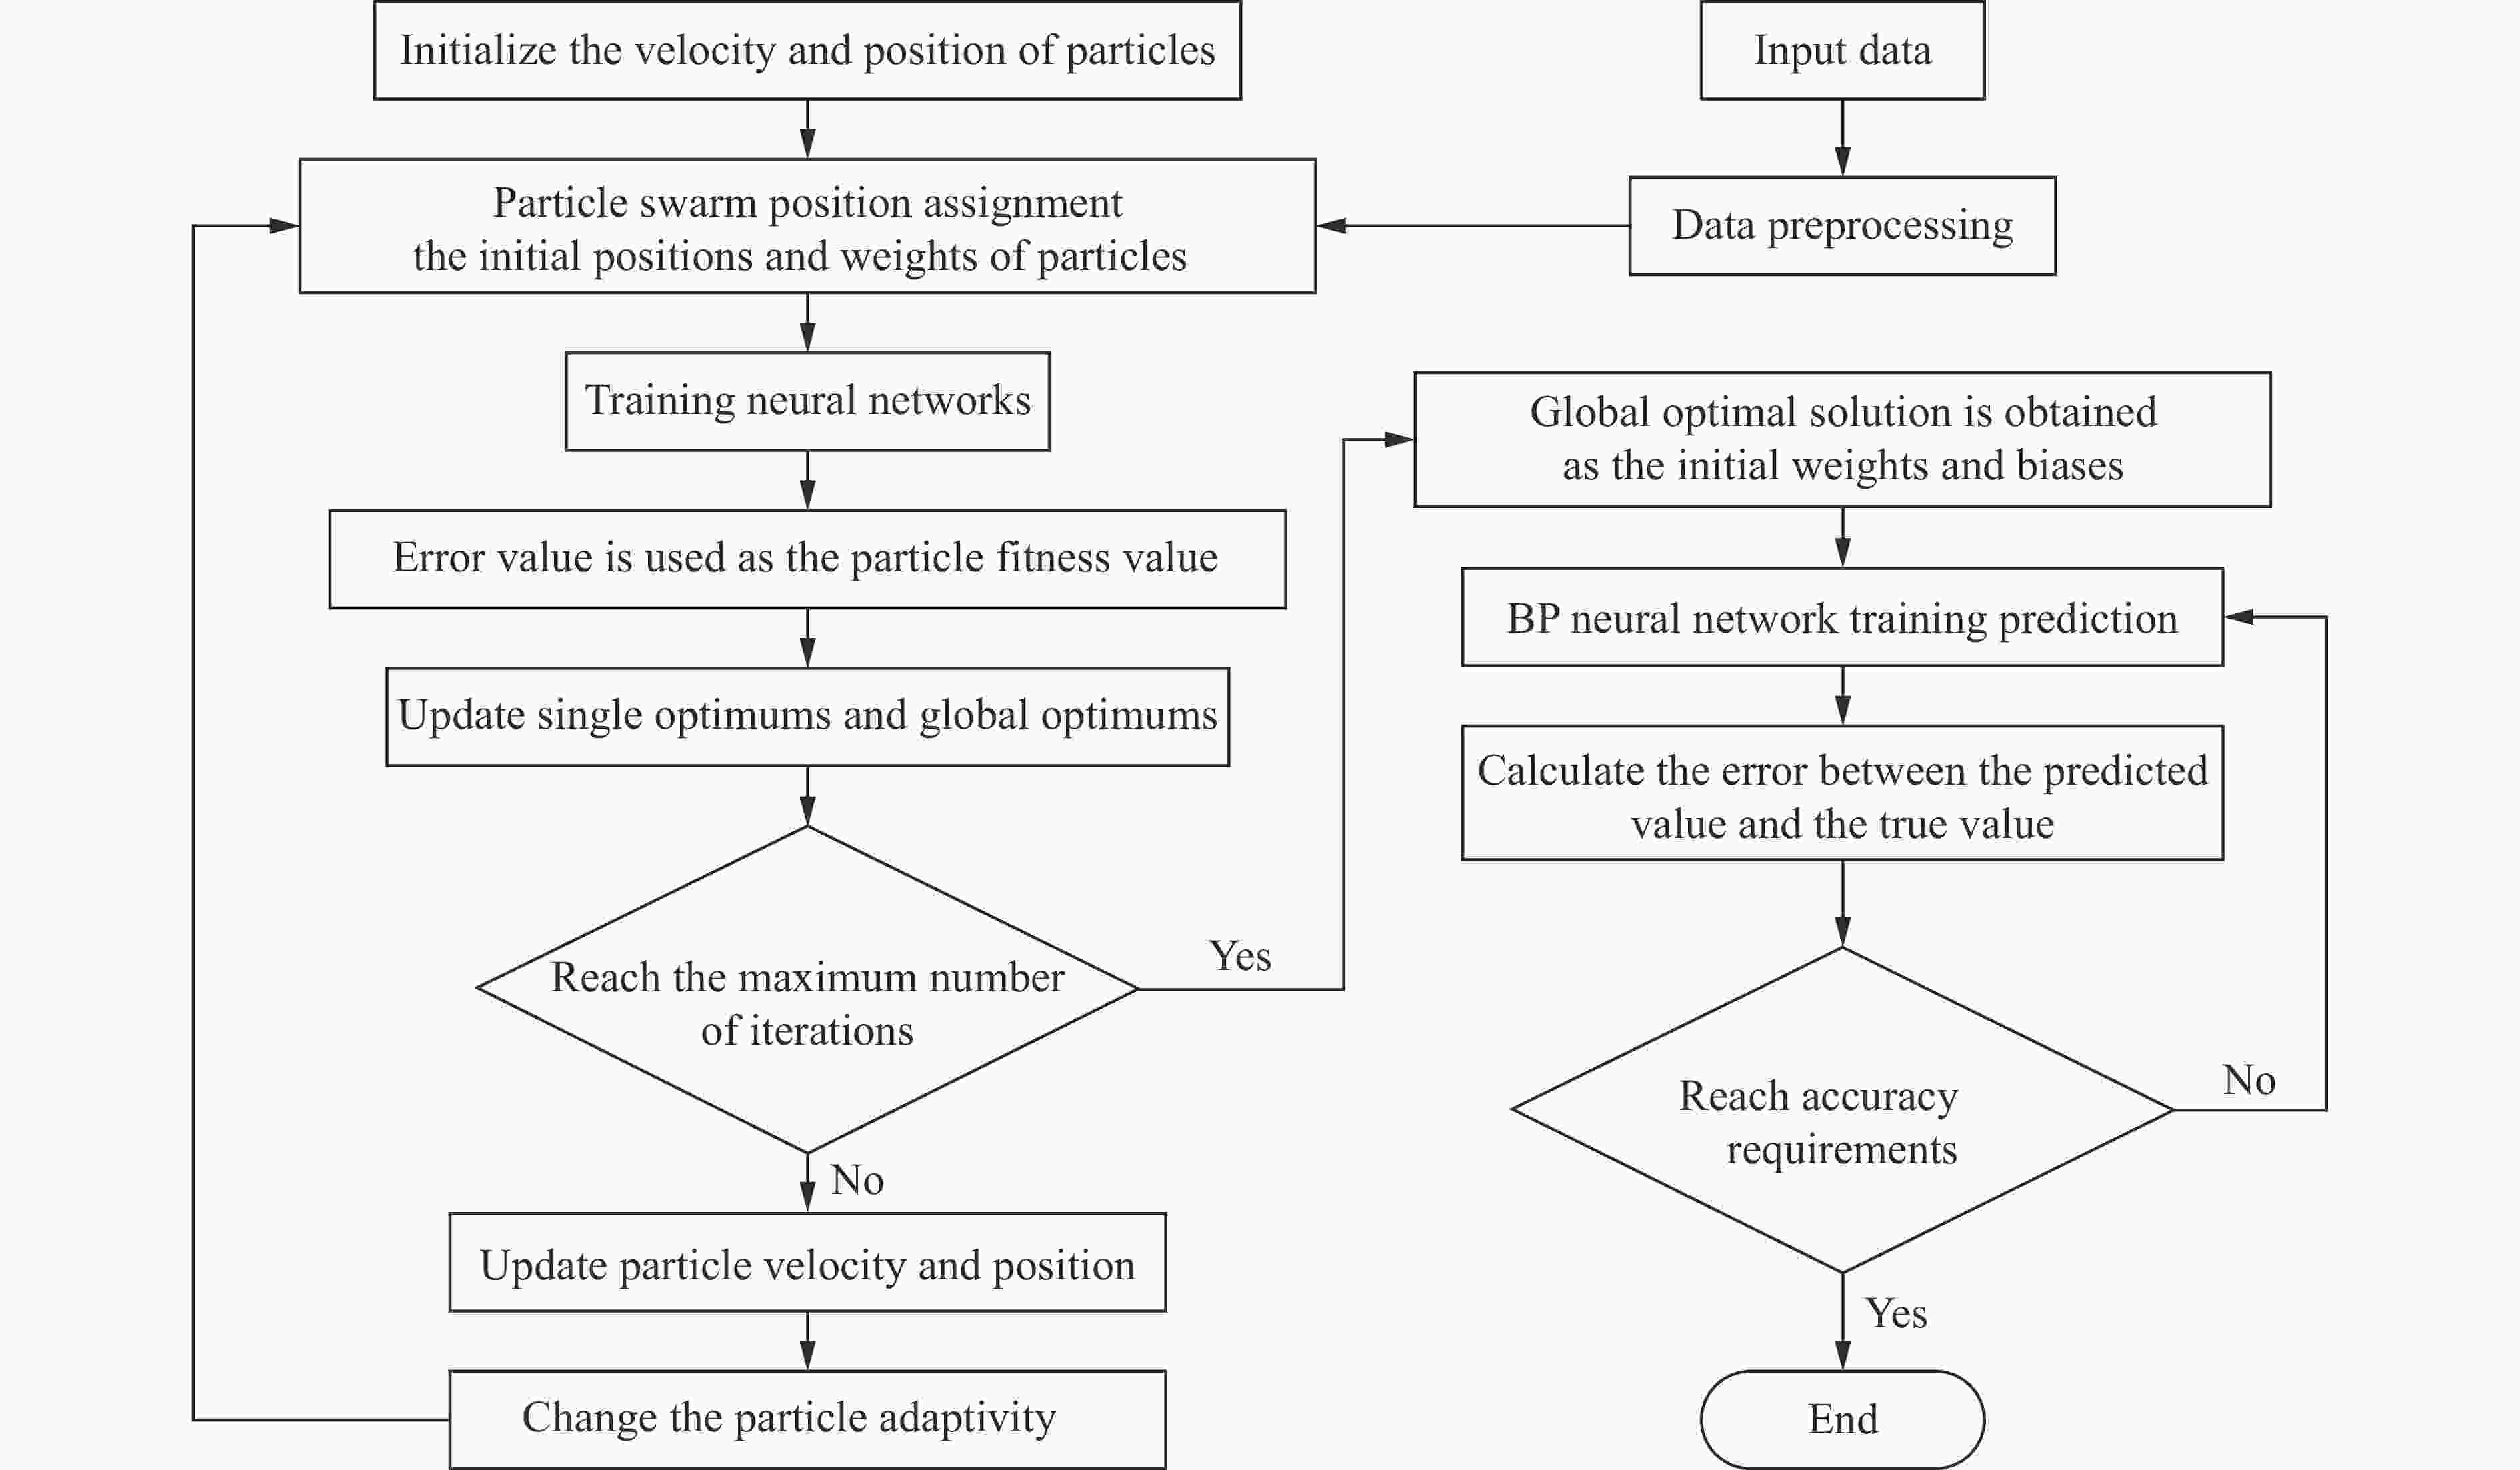
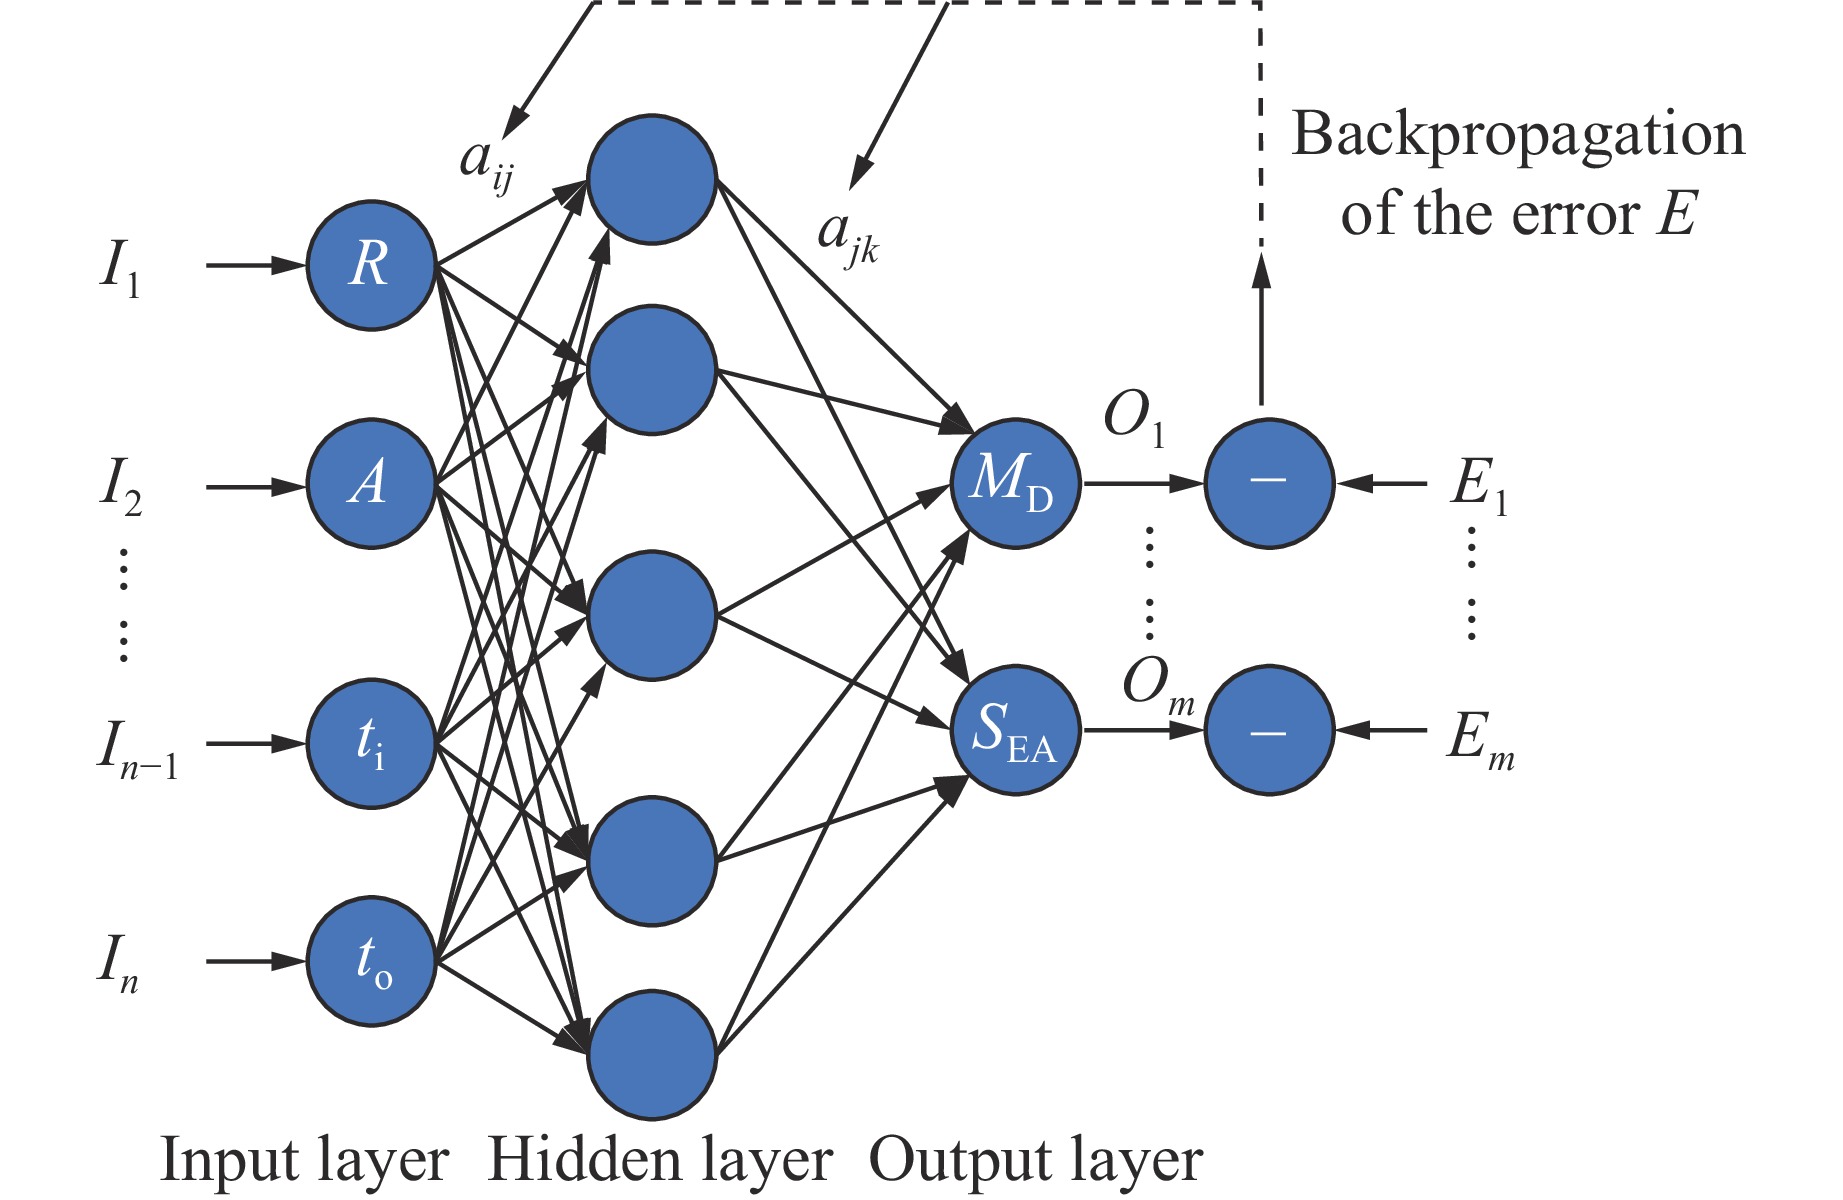
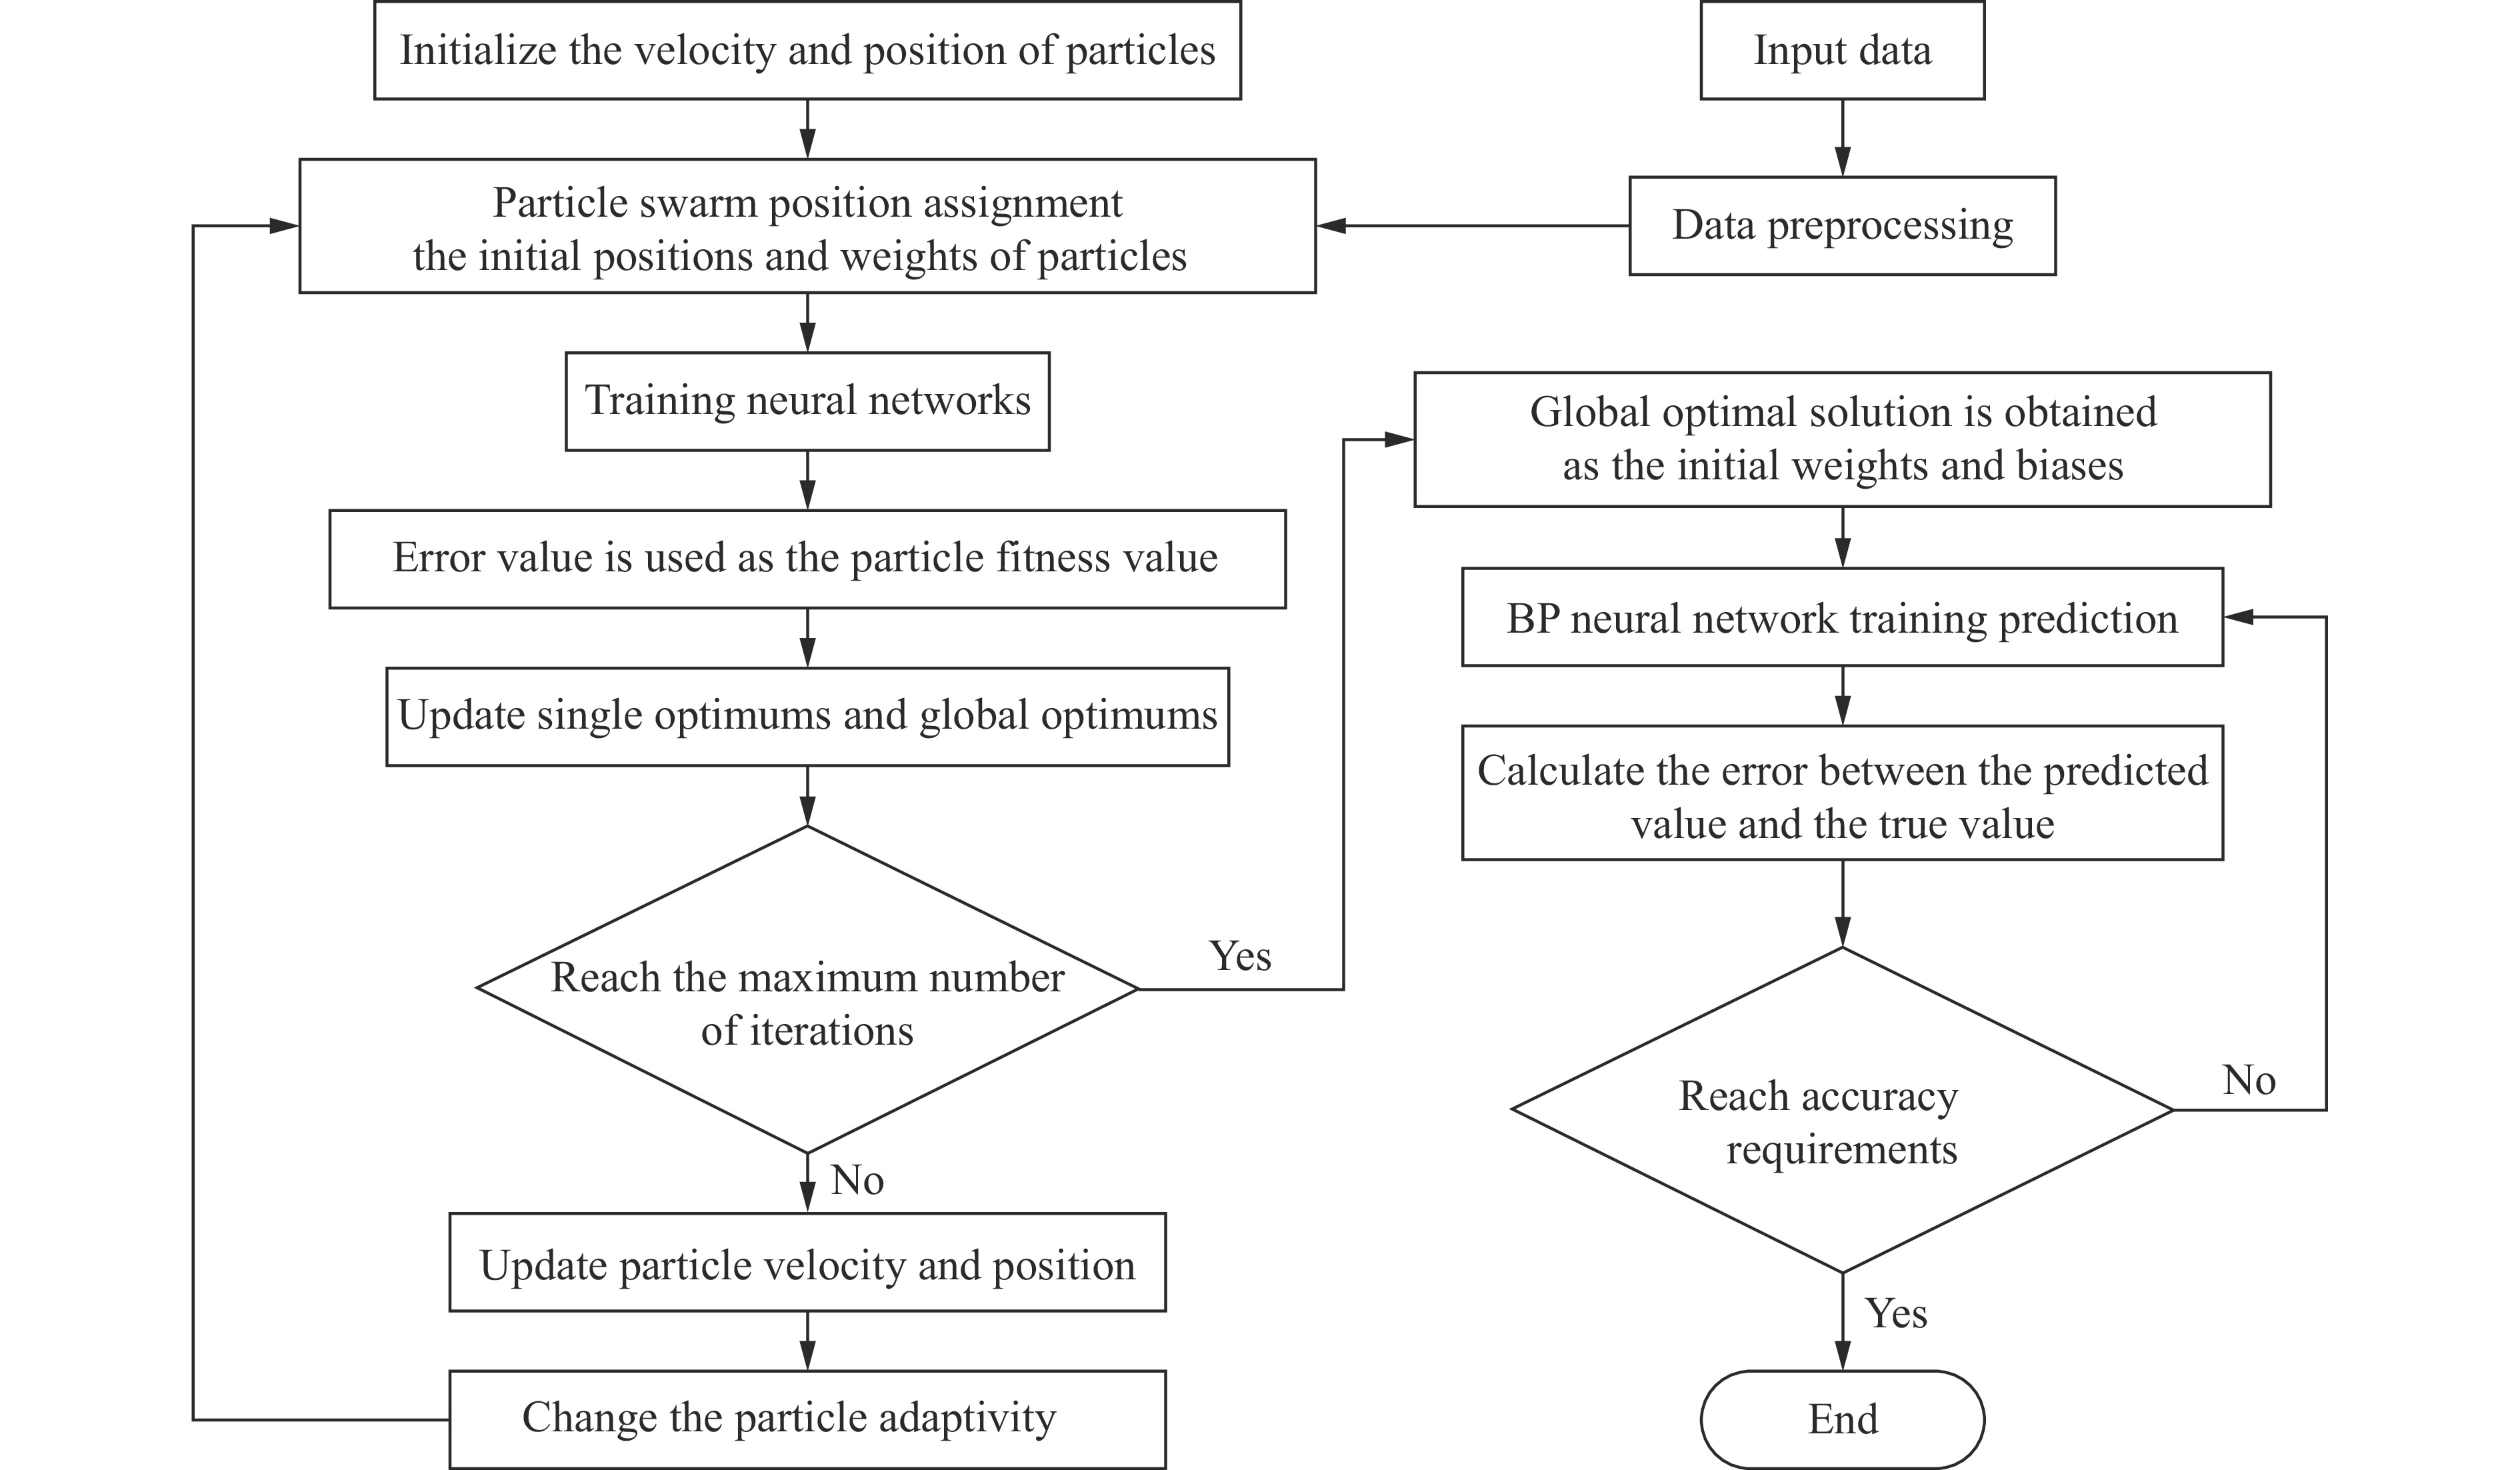
图 13 粒子群优化神经网络算法流程
Figure 13. Flow chart of particle swarm optimization neural network algorithm
图 14 预测结果对比:(a) SEA的BP预测与FE结果比较,(b) MD的BP预测与FE结果比较,(c) SEA的PSO-BP预测与FE结果比较,(d) MD的PSO-BP预测与FE结果比较,(e) SEA的RSM预测与FE结果比较,(f) MD的RSM预测与FE结果比较
Figure 14. Comparison of predicted results: (a) comparison of BP prediction with FE results of SEA; (b) comparison of BP prediction with FE results of MD; (c) comparison of PSO-BP prediction with FE results of SEA; (d) comparison of PSO-BP prediction with FE results of MD; (e) comparison of RSM prediction with FE results of SEA; (f) comparison of RSM prediction with FE results of MD
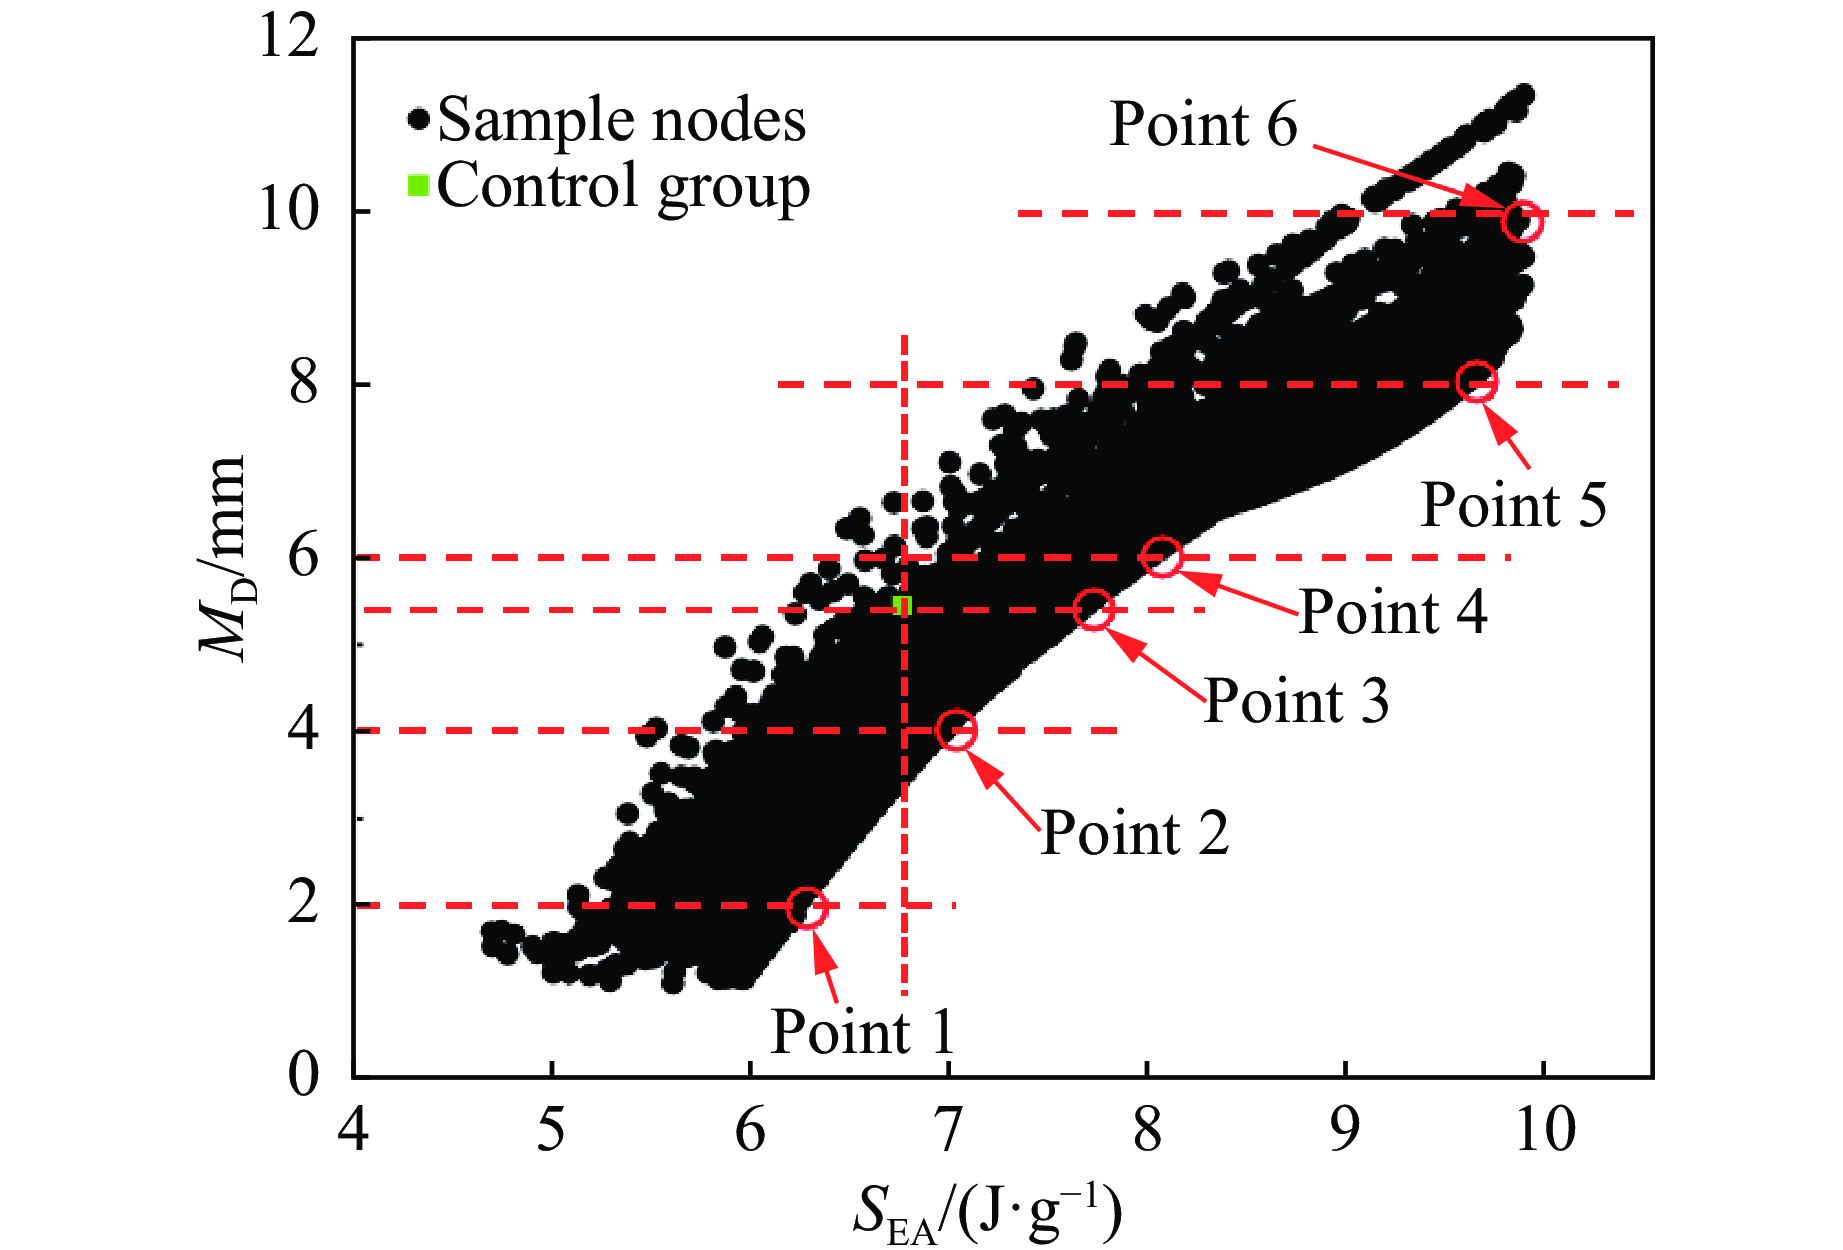
图 15 RSM生成的样本点与对照组的动态响应
Figure 15. Dynamic responses of the sample nodes by RSM and the control group
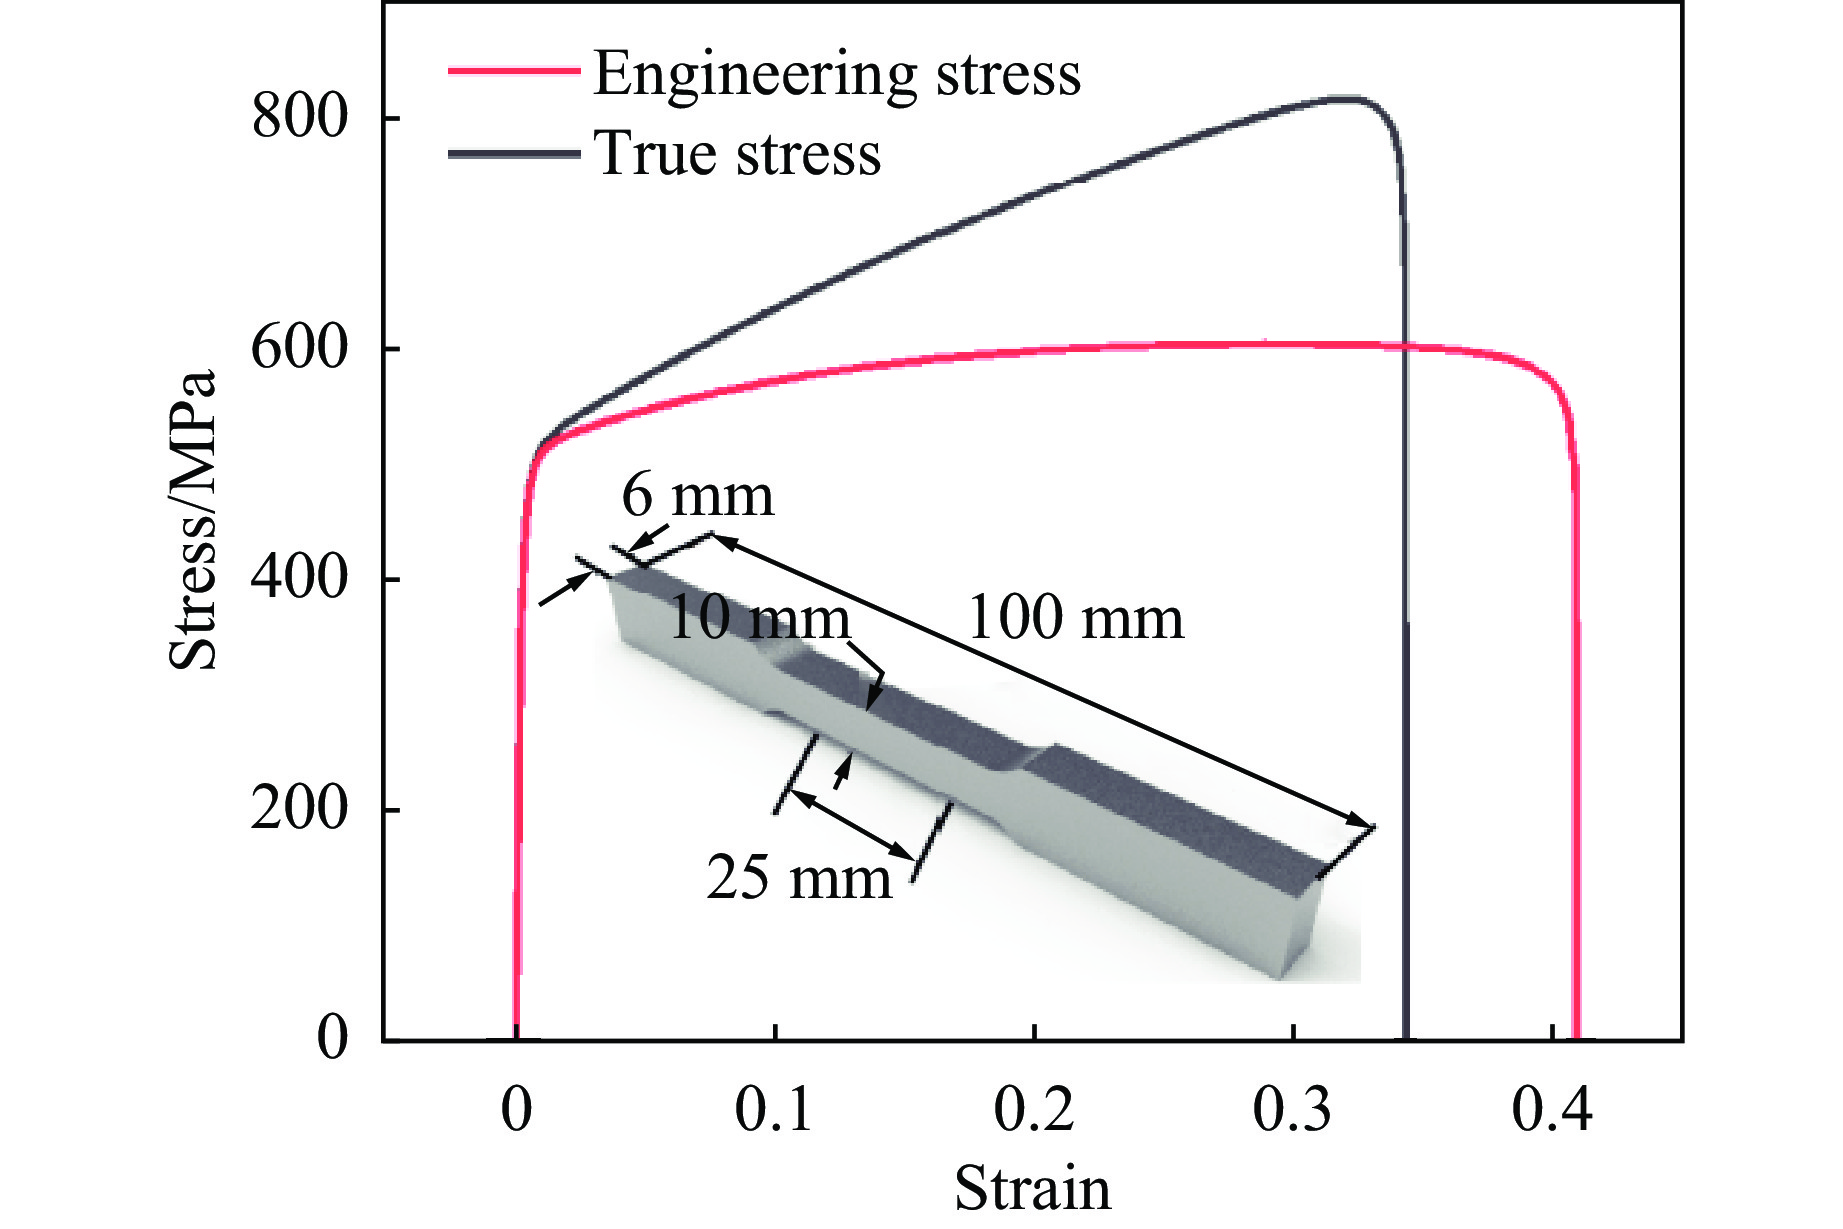
表 1 材料参数
Table 1. Material parameters
Material Density/(kg∙m−3) Young’s modulus/GPa Poisson’s ratio Yield stress/MPa 316L steel 7830 185 0.30 470 304 steel 7830 193 0.25 250  下载: 导出CSV
表 2 双向波纹夹芯管的变形/失效实验测定值
Table 2. Deformation/failure test values of bidirectional bellows sandwich tube
Sample $ {\varepsilon _h} $/% $ l $/mm cl/mm cw/mm Inner tube Outer tube Inner tube Outer tube Inner tube crack Core crack Outer tube crack Inner tube crack Core crack Outer tube crack A2 4.1 2.6 85 48 R4 5.1 2.1 112 30 46 0.3 R4A2 4.6 2.6 127 40 76 57 14 3 R5A2 4.6 3.1 145 64 80 72 11 5
下载: 导出CSV
表 3 内外管中点挠度的数值模拟与实验结果的对比
Table 3. Comparison between numerical simulation and experimental results for mid-point deflection of inner and outer tubes
Sample R A ti/mm to/mm MD for inner tube MD for outer tube Sim./mm Exp./mm Error/% Sim./mm Exp./mm Error/% A2 0 2 2 2 10.8 11.2 3.7 4.9 4.6 −6.1 R4 4 0 2 2 11.8 12.0 1.7 6.0 5.6 −6.7 R4A2 4 2 2 2 15.2 14.0 −7.9 5.5 5.0 −8.2 R5A2 5 2 2 2 18.8 18.0 −4.2 9.5 8.5 −10.5
下载: 导出CSV
表 4 计算模型数与CPU计算时间
Table 4. Calculated model number and CPU calculation time
Model Number of CPU* Number of meshes Calculation time/min k=50 k=100 k=200 k=500 k= 1000 FE 8 55850 475 950 1 900 4750 9500 BP 2 950 951 952 954 958 PSO-BP 2 954 959 968 996 1042 RSM 2 950 950 951 954 957 Note: * Intel (R) Core (TM) i7-13700 2.10 GHz
下载: 导出CSV
表 5 预测模型误差分析
Table 5. Error analysis of prediction models
Model $ {\theta _{{\text{relative}}}} $/% $ {\theta _{{\text{average}}}} $/% $ {R^2} $ SEA MD SEA MD SEA MD BP 2.05 33.2 0.48 6.65 0.999 0.975 PSO-BP 2.15 28.3 0.35 3.52 0.999 0.994 RSM 0.97 22.1 0.25 0.24 0.999 0.996
下载: 导出CSV
表 6 最大$M_{\mathrm{D}}$约束下最大化$S_{\mathrm{EA}} $的优化设计
Table 6. Optimal design of maximized $S_{\mathrm{EA}} $ with maximum $M_{\mathrm{D}} $ constraints
No. R A ti/mm to/mm MD/mm SEA/(J∙g−1) RSM FE RSM FE 1 3 6 2.40 1.50 2.00 2.12 6.27 6.28 2 6 4 2.20 1.50 4.00 4.00 6.96 6.97 3 6 5 2.05 1.50 5.24 5.22 7.57 7.56 4 6 5 1.94 1.50 6.00 5.97 8.00 8.02 5 6 6 1.58 1.50 8.00 8.05 9.40 9.44 6 5 5 1.50 1.50 10.00 8.80 9.89 9.93
下载: 导出CSV
-
[1] PANDARKAR A, GOEL M D, HORA M S. Axial crushing of hollow and foam filled tubes: an overview [J]. Sādhanā, 2016, 41(8): 909–921. [2] YAO R Y, PANG T, ZHANG B, et al. On the crashworthiness of thin-walled multi-cell structures and materials: state of the art and prospects [J]. Thin-Walled Structures, 2023, 189: 110734. doi: 10.1016/j.tws.2023.110734 [3] XUE Z Y, HUTCHINSON J W. A comparative study of impulse-resistant metal sandwich plates [J]. International Journal of Impact Engineering, 2004, 30(10): 1283–1305. doi: 10.1016/j.ijimpeng.2003.08.007 [4] ZHANG P, CHENG Y S, LIU J, et al. Experimental and numerical investigations on laser-welded corrugated-core sandwich panels subjected to air blast loading [J]. Marine Structures, 2015, 40: 225–246. doi: 10.1016/j.marstruc.2014.11.007 [5] WEI Y C, ZHANG C J, YUAN Y, et al. Blast response of additive manufactured Ti-6Al-4V sandwich panels [J]. International Journal of Impact Engineering, 2023, 176: 104553. doi: 10.1016/j.ijimpeng.2023.104553 [6] SHEN J H, LU G X, ZHAO L M, et al. Short sandwich tubes subjected to internal explosive loading [J]. Engineering Structures, 2013, 55: 56–65. doi: 10.1016/j.engstruct.2011.12.005 [7] LIU X R, TIAN X G, LU T J, et al. Blast resistance of sandwich-walled hollow cylinders with graded metallic foam cores [J]. Composite Structures, 2012, 94(8): 2485–2493. doi: 10.1016/j.compstruct.2012.02.029 [8] LIANG M Z, LI X Y, LIN Y L, et al. Multiobjective blast-resistance optimization of gradient foam sandwiched cylindrical container [J]. Thin-Walled Structures, 2020, 157: 107114. doi: 10.1016/j.tws.2020.107114 [9] LI S Q, LU G X, WANG Z H, et al. Finite element simulation of metallic cylindrical sandwich shells with graded aluminum tubular cores subjected to internal blast loading [J]. International Journal of Mechanical Sciences, 2015, 96/97: 1–12. doi: 10.1016/j.ijmecsci.2015.03.011 [10] ZHANG T H, LIU Z F, LI S Q, et al. Dynamic response and energy absorption performance of aluminum foam-filled sandwich circular tubes under internal blast loading [J]. International Journal of Impact Engineering, 2023, 173: 104458. doi: 10.1016/j.ijimpeng.2022.104458 [11] YANG F, XIE W H, MENG S H. Impact and blast performance enhancement in bio-inspired helicoidal structures: a numerical study [J]. Journal of the Mechanics and Physics of Solids, 2020, 142: 104025. doi: 10.1016/j.jmps.2020.104025 [12] 王海任, 李世强, 刘志芳, 等. 爆炸载荷下双向梯度仿生夹芯圆板的力学行为 [J]. 爆炸与冲击, 2021, 41(4): 043201. doi: 10.11883/bzycj-2020-0132WANG H R, LI S Q, LIU Z F, et al. Mechanical behaviors of bi-directional gradient bio-inspired circular sandwich plates under blast loading [J]. Explosion and Shock Waves, 2021, 41(4): 043201. doi: 10.11883/bzycj-2020-0132 [13] GHAZLAN A, NGO T, VAN LE T, et al. Blast performance of a bio-mimetic panel based on the structure of nacre: a numerical study [J]. Composite Structures, 2020, 234: 111691. doi: 10.1016/j.compstruct.2019.111691 [14] YANG X F, MA J X, SHI Y L, et al. Crashworthiness investigation of the bio-inspired bi-directionally corrugated core sandwich panel under quasi-static crushing load [J]. Materials & Design, 2017, 135: 275–290. [15] YANG J K, GU D D, LIN K J, et al. Optimization of bio-inspired bi-directionally corrugated panel impact-resistance structures: numerical simulation and selective laser melting process [J]. Journal of the Mechanical Behavior of Biomedical Materials, 2019, 91: 59–67. doi: 10.1016/j.jmbbm.2018.11.026 [16] DALIRI V, ZEINEDINI A. Flexural behavoiur of the composite sandwich panels with novel and regular corrugated cores [J]. Applied Composite Materials, 2019, 26(3): 963–982. doi: 10.1007/s10443-019-09761-x [17] SHAHBAZI A, ZEINEDINI A. Impact response of E-glass/epoxy composite bi-directional corrugated core sandwich panels [J]. Polymers and Polymer Composites, 2021, 29(9): 1563–1574. doi: 10.1177/0967391120982751 [18] 黄晗, 许述财, 陈姮. 仿生波纹夹层结构耐撞性分析及优化 [J] 爆炸与冲击, 2021, 41(8): 083102.HUANG H, XU S C, CHEN H. Crashworthiness analysis and optimization of bionic corrugated sandwich structures [J]. Explosion and Shock Waves, 2021, 41(8): 083102. [19] LI X, XU R, ZHANG X, et al. Inner blast response of fiber reinforced aluminum tubes [J]. International Journal of Impact Engineering, 2023, 172: 104416. doi: 10.1016/j.ijimpeng.2022.104416 [20] LI S Q, YU B L, KARAGIOZOVA D, et al. Experimental, numerical, and theoretical studies of the response of short cylindrical stainless steel tubes under lateral air blast loading [J]. International Journal of Impact Engineering, 2019, 124: 48–60. doi: 10.1016/j.ijimpeng.2018.10.004 [21] CHENG J H, GUSSEV M, ALLEN J, et al. Deformation and failure of PrintCast A356/316L composites: digital image correlation and finite element modeling [J]. Materials & Design, 2020, 195: 109061. [22] XIAO D B, DONG Z C, LI Y, et al. Compression behavior of the graded metallic auxetic reentrant honeycomb: experiment and finite element analysis [J]. Materials Science and Engineering: A, 2019, 758: 163–171. doi: 10.1016/j.msea.2019.04.116 [23] 朱玉富, 赵春风, 周志航. 基于机器学习的钢筋混凝土板在爆炸作用下的最大位移预测模型 [J] 高压物理学报, 2023, 37(2): 024205.ZHU Y F, ZHAO C F, ZHOU Z H. Prediction model of maximum displacement for RC slabs under blast load based on machine learning [J]. Chinese Journal of High Pressure Physics, 2023, 37(2): 024205. [24] CHEN D, JING L, YANG F. Optimal design of sandwich panels with layered-gradient aluminum foam cores under air-blast loading [J]. Composites Part B: Engineering, 2019, 166: 169–186. doi: 10.1016/j.compositesb.2018.11.125 -

 下载:
下载:


计量
- 文章访问数: 586
- HTML全文浏览量: 338
- PDF下载量: 37
