


Optimized Design and Energy Absorption of TPU Material Based on Hierarchical Structure
-
摘要: 选择柔性热塑性聚氨酯(TPU)为原料制备实验试样。基于面心立方层级结构,改变结构的直梁样式、间距,并将蜂窝结构层引入结构中,通过实验和有限元分析,研究层级结构在准静态加载下的变形模式和吸能特性。实验结果与有限元分析得到的载荷-位移曲线吻合较好。结果表明:与初始面心立方层级结构相比,增大直梁的振幅,调整直梁间距为2 mm,即增加塑性铰个数时,又或将蜂窝结构层引入层级结构,可以大幅提高层级结构的能量吸收性能;减小间距、增多塑性铰数目对改善层级结构吸能能力的效果最优;D-1构型与M-1构型相比,比吸能提高了46%;调整塑性铰位置时,层级结构会发生屈曲,不利于层级结构的能量吸收;与M-1构型相比,D-2和D-3构型的比吸能分别降低了27%和34%。Abstract: In this paper, the deformation behavior and energy absorption performance of the hierarchical structure were investigated based on the face-centered cubic hierarchical structure to change the amplitude and distance of the hierarchical structure’s straight beams and introduce the honeycomb structure layer. The quasi-static compression behavior of the proposed hierarchical structure was carried out through finite element methods (FEM) and experimental tests. Thermoplastic polyurethanes (TPU) as the raw material was used to prepare the experimental samples. The force-displacement curves obtained from the FEM and experimental tests are consistent with each other. Compared with the original face-centered cubic layered structure, the conclusion can be obtained: the new hierarchical structure has better energy absorption performance than the face-centered cubic hierarchical structure. The introduction of sinusoidal beams, the increase of plastic hinges, the adjustment of the angle between layers, and the introduction of honeycomb structure layers can enhance the energy absorption ability.
-
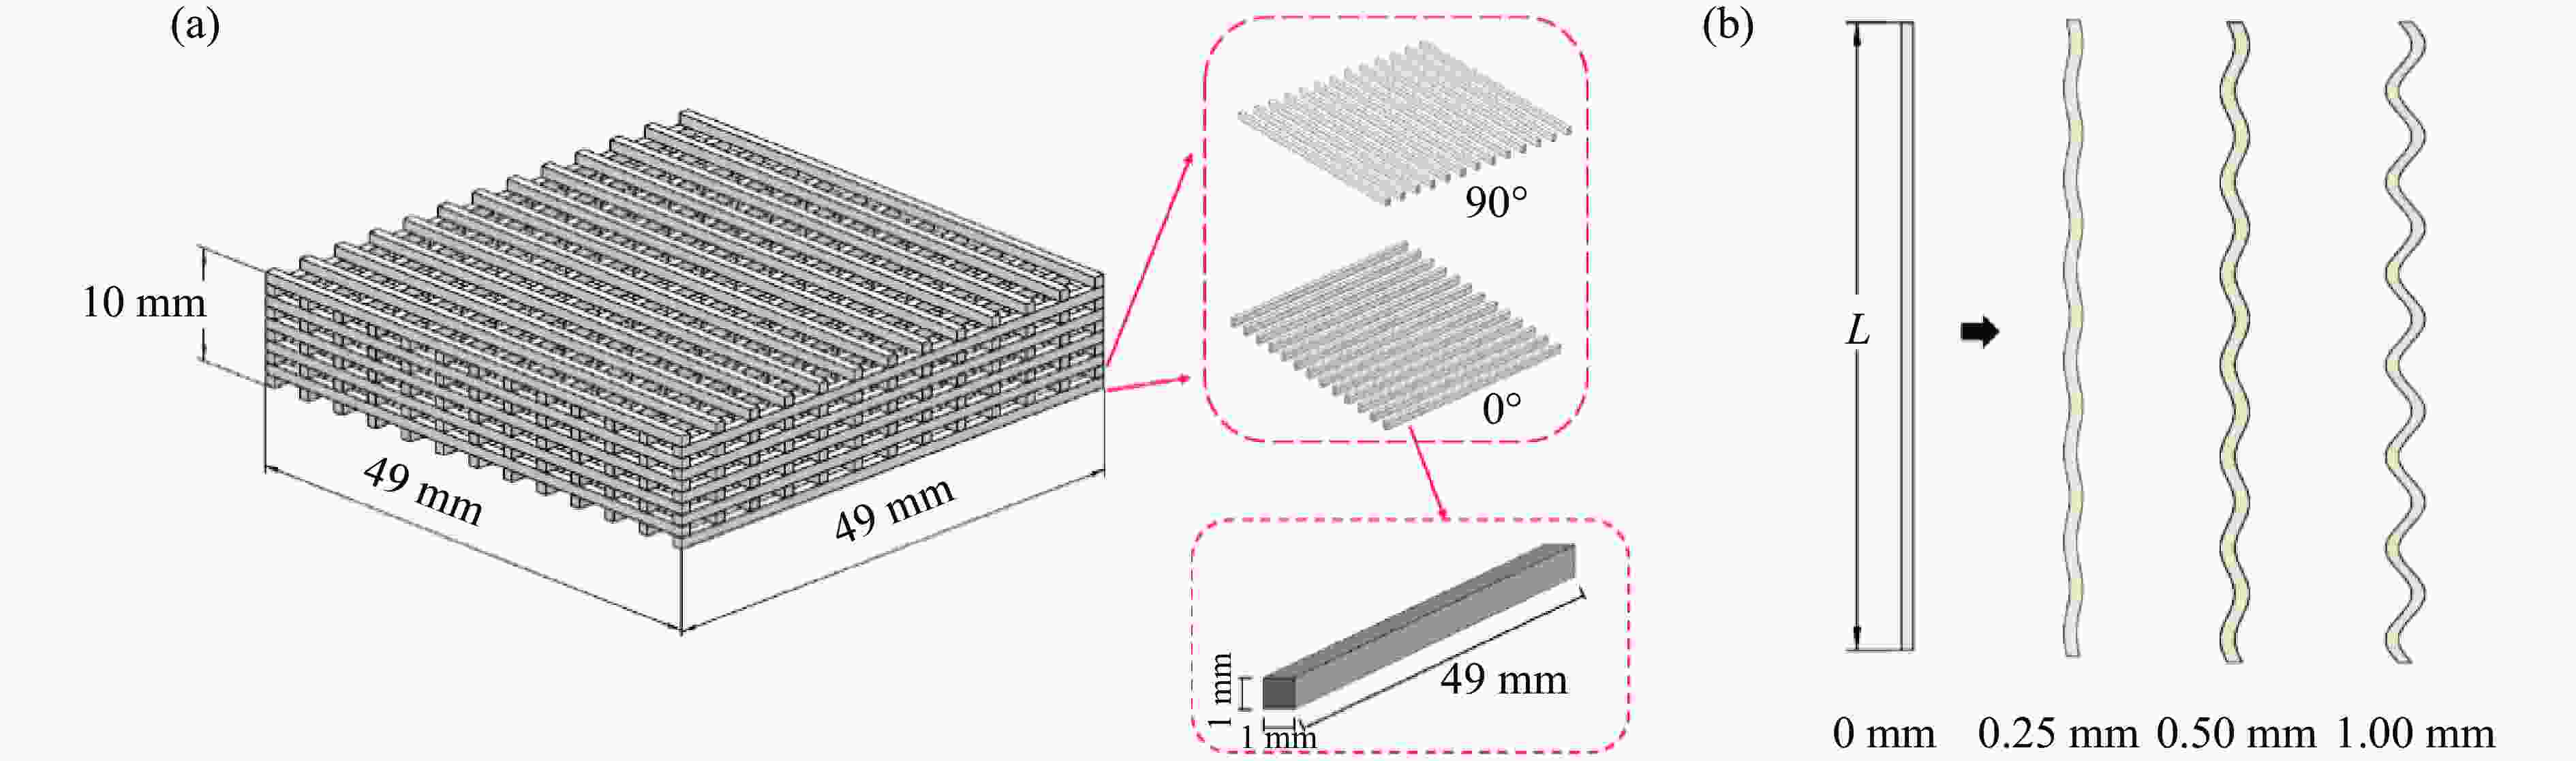
图 1 面心立方层级结构(a)和不同振幅下的正弦曲线梁(b)
Figure 1. Face-centered cubic hierarchical structure (a) and sinusoidal beams of different amplitudes (b)
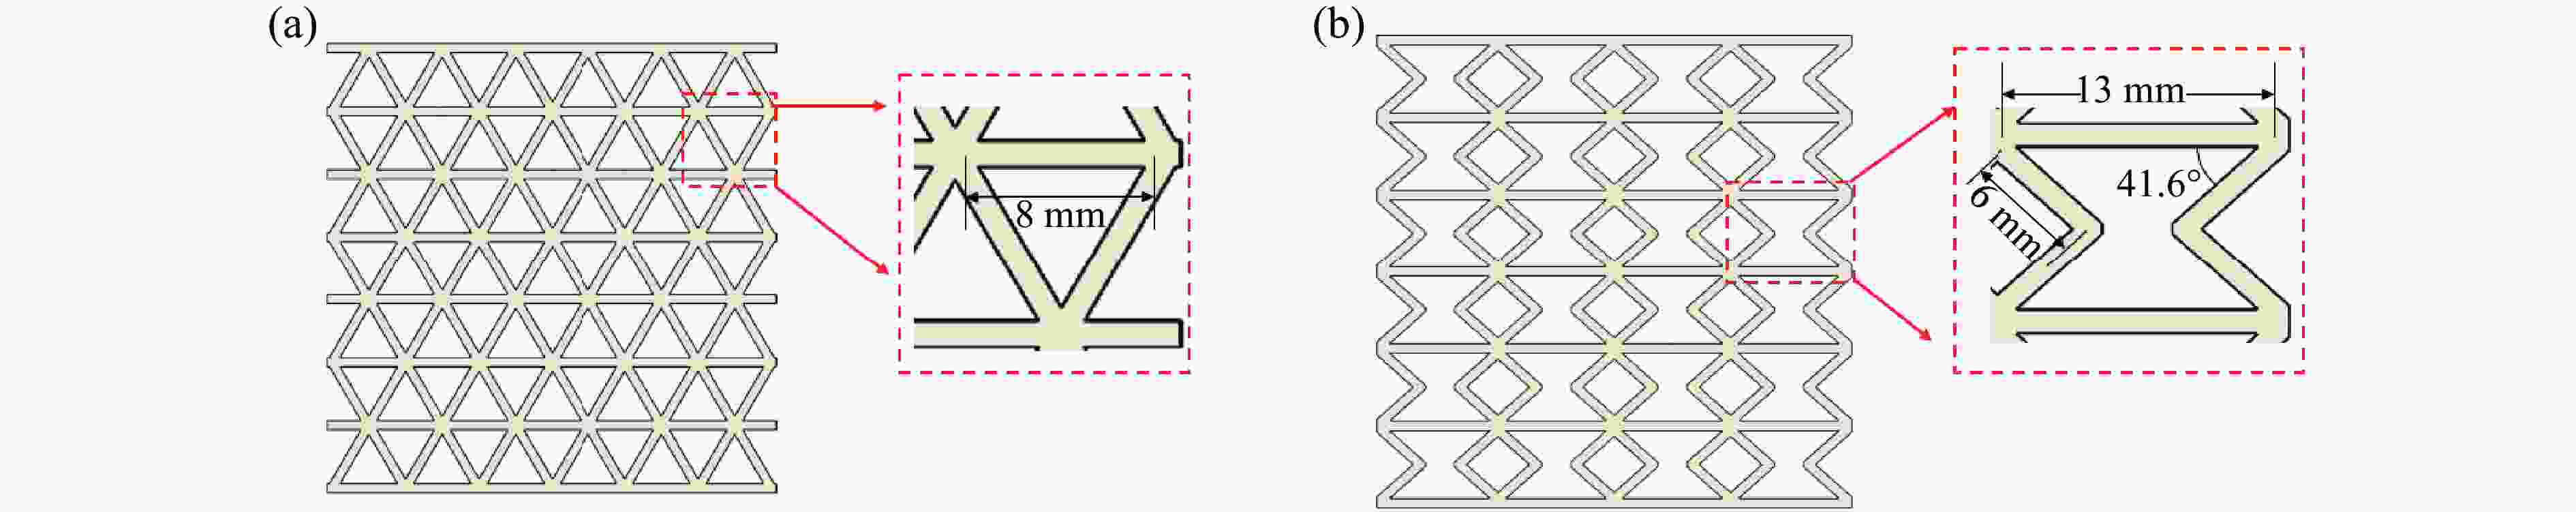
图 3 蜂窝结构层:(a)正三角形,(b)内凹形
Figure 3. Honeycomb structure layer: (a) regular triangle,(b) re-entrant
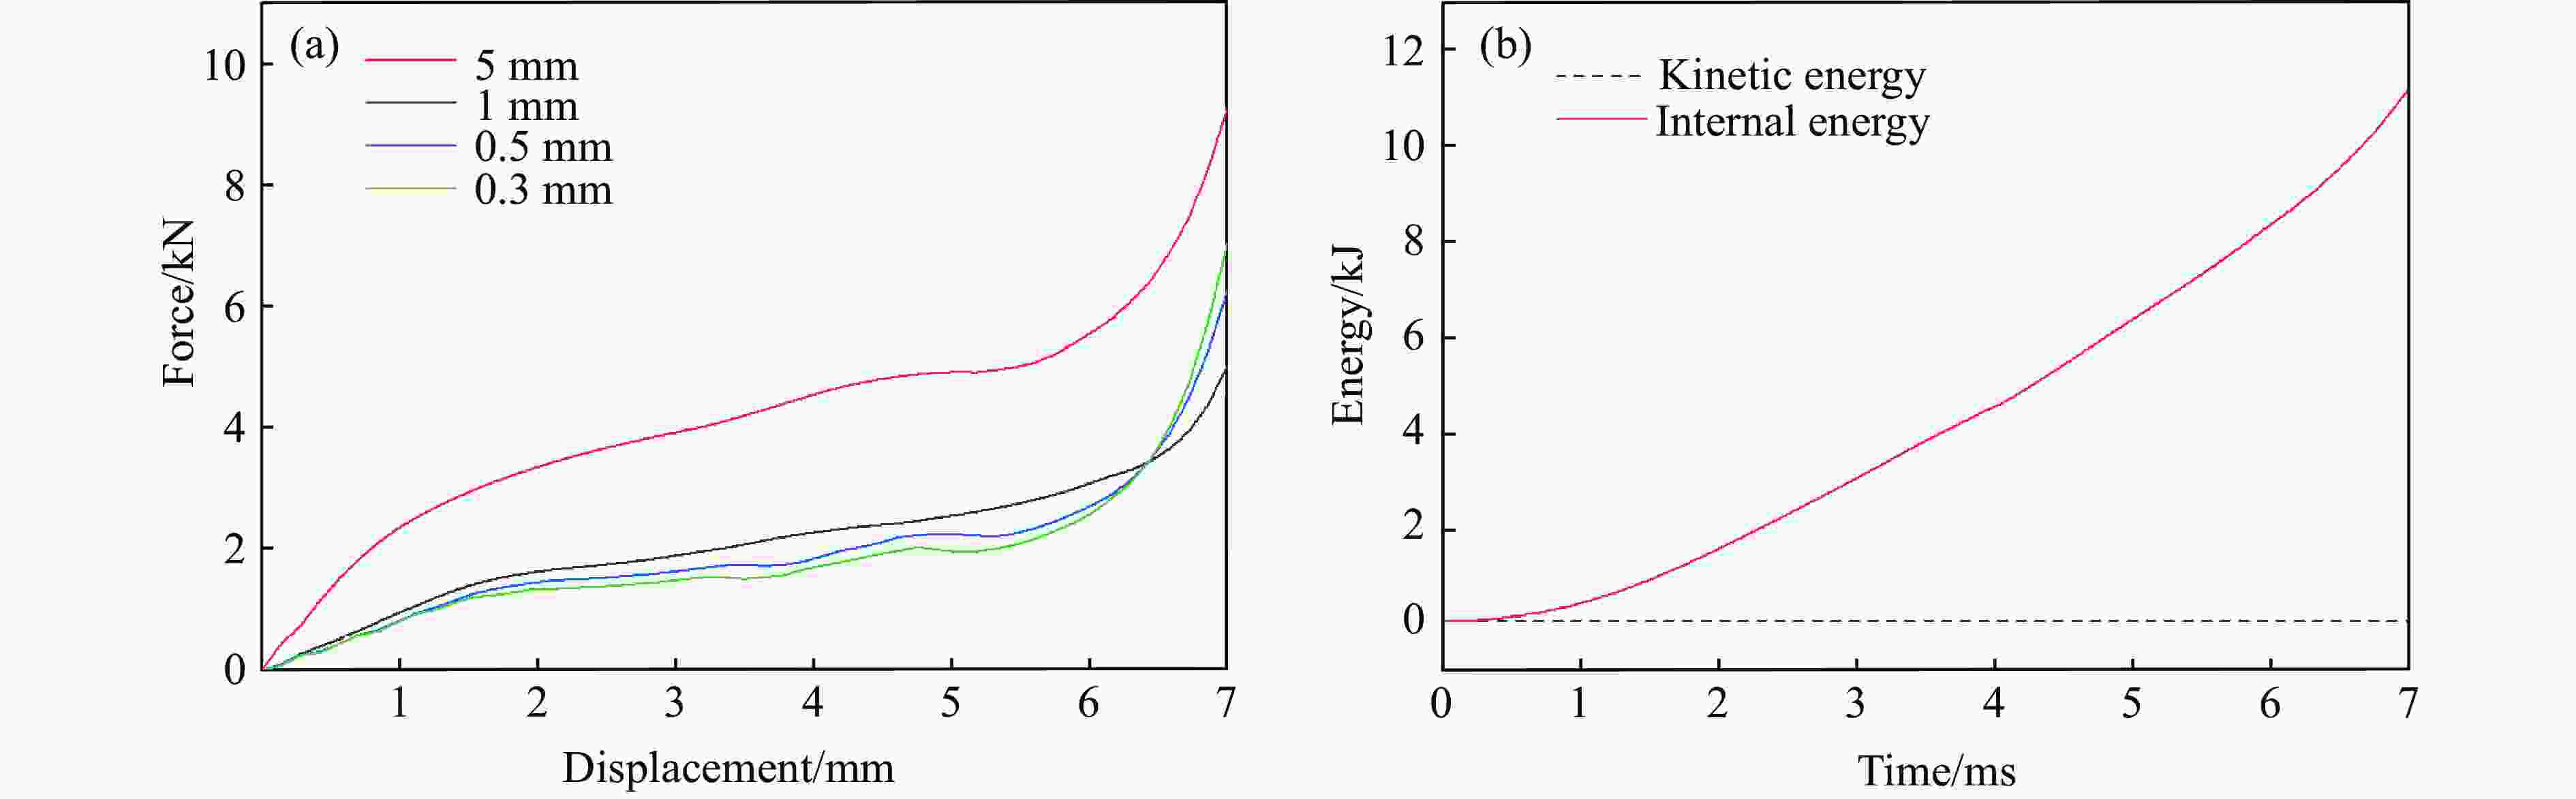
图 5 不同网格尺寸下M-1构型的载荷-位移曲线(a)和能量时程曲线(b)
Figure 5. Force-displacement curves of M-1 with different mesh sizes (a) and time history of energy (b)
图 6 实验试样 (a) 和CMT5305万能试验机 (b)
Figure 6. Experimental samples (a) and CMT5305 universal testing machine (b)
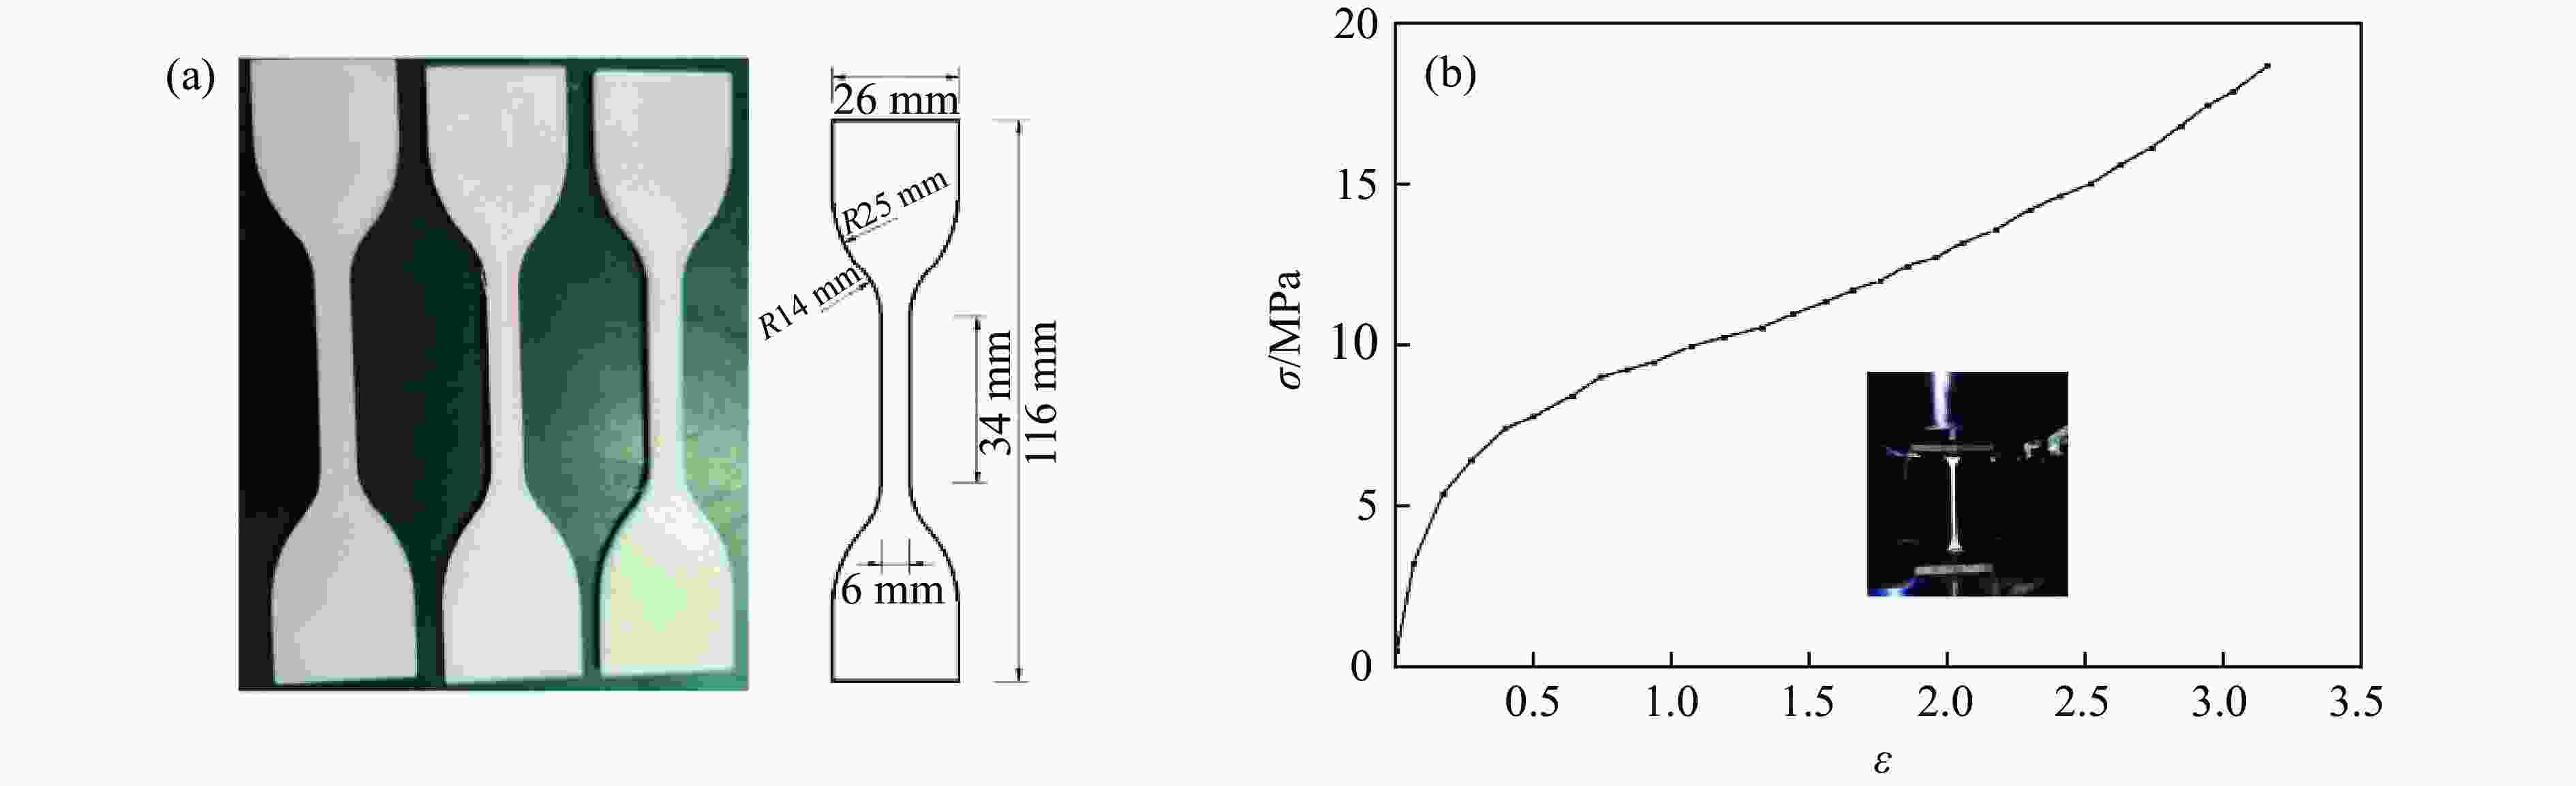
图 7 (a) 拉伸试样及尺寸和 (b) TPU材料的应力-应变曲线
Figure 7. (a) Tensile specimens and its dimensions,(b) stress-strain curve of TPU
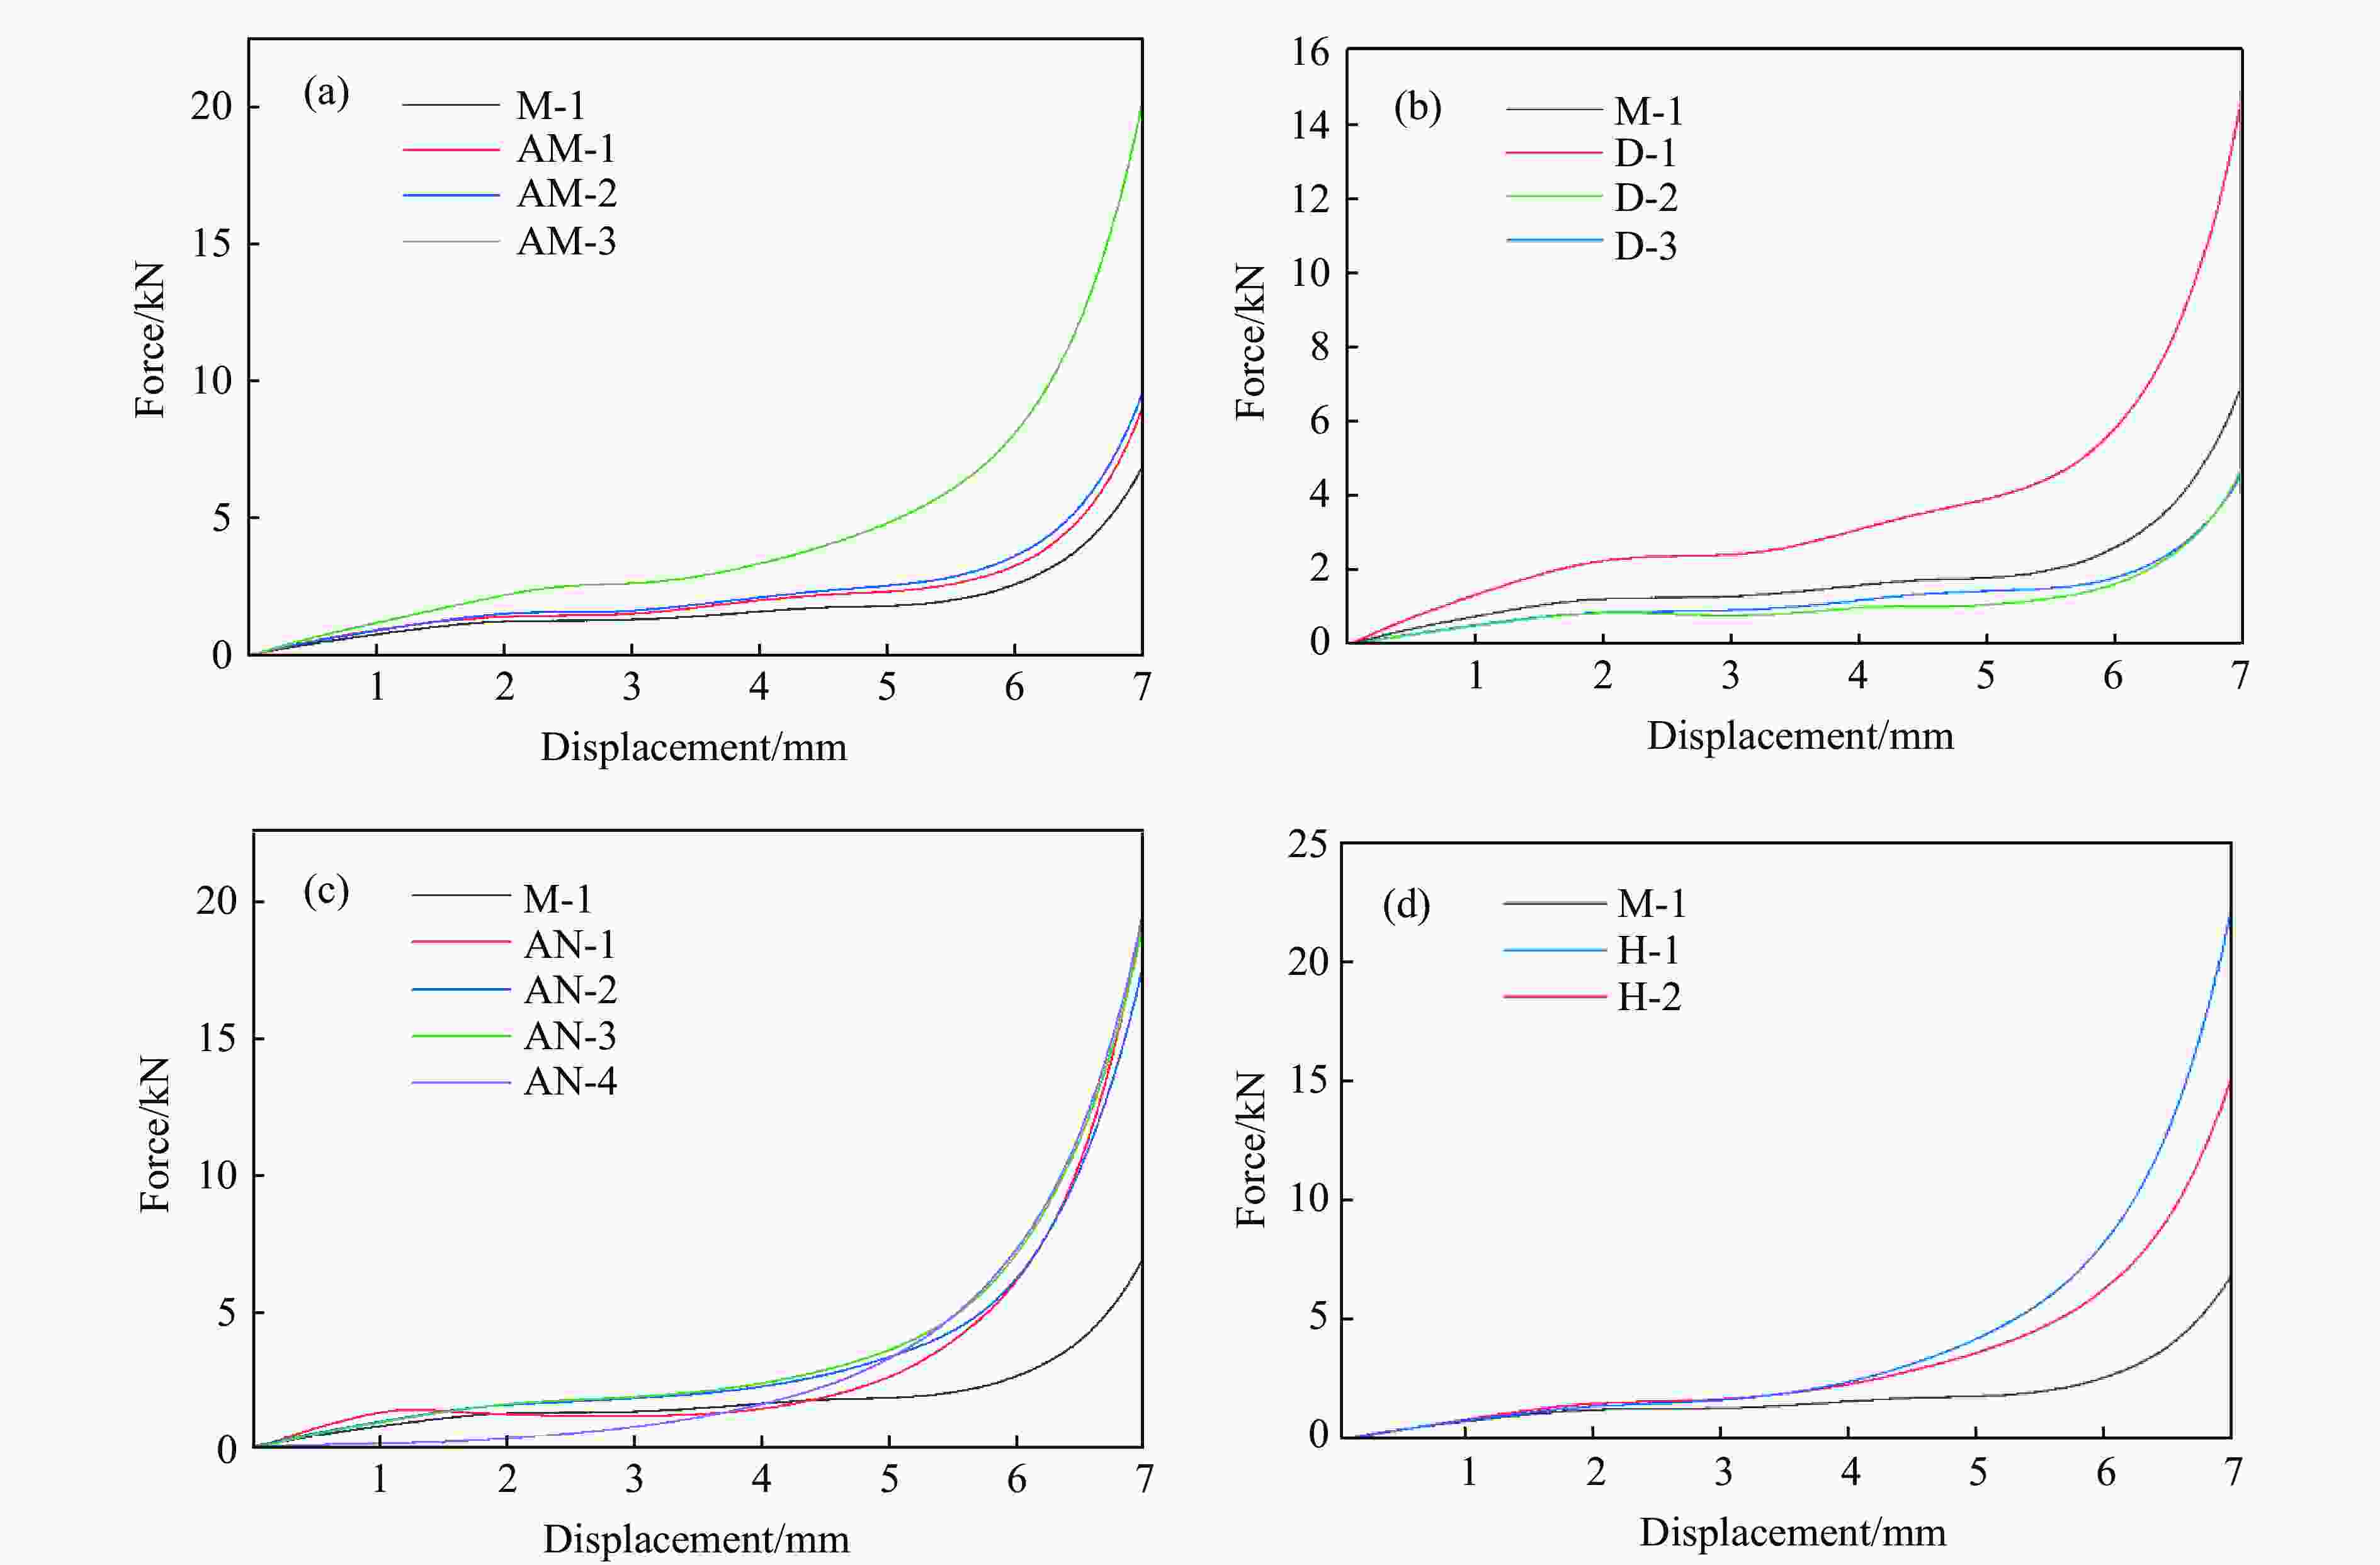
图 8 调整幅值(a)、间距(b)、角度(c)以及插入蜂窝结构层(d)时层级结构试样的载荷-位移曲线
Figure 8. Force-displacement curves of hierarchical structure sample: adjustment of (a) amplitude, (b) distance, (c) angle and (d) introducing honeycomb structural layers
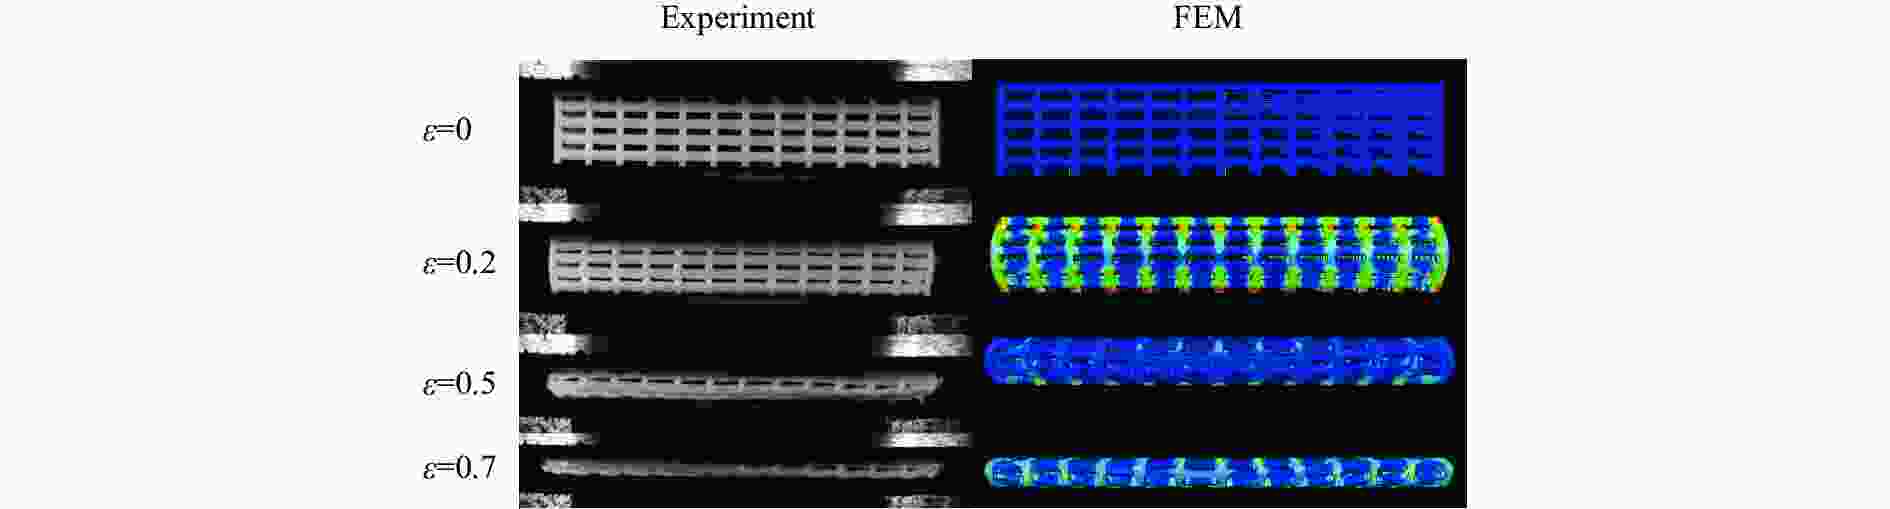
图 9 M-1试样不同阶段变形模式的实验与有限元模拟结果对比
Figure 9. Experimental and finite element simulation comparison of deformation modes of M-1 specimens at different stages
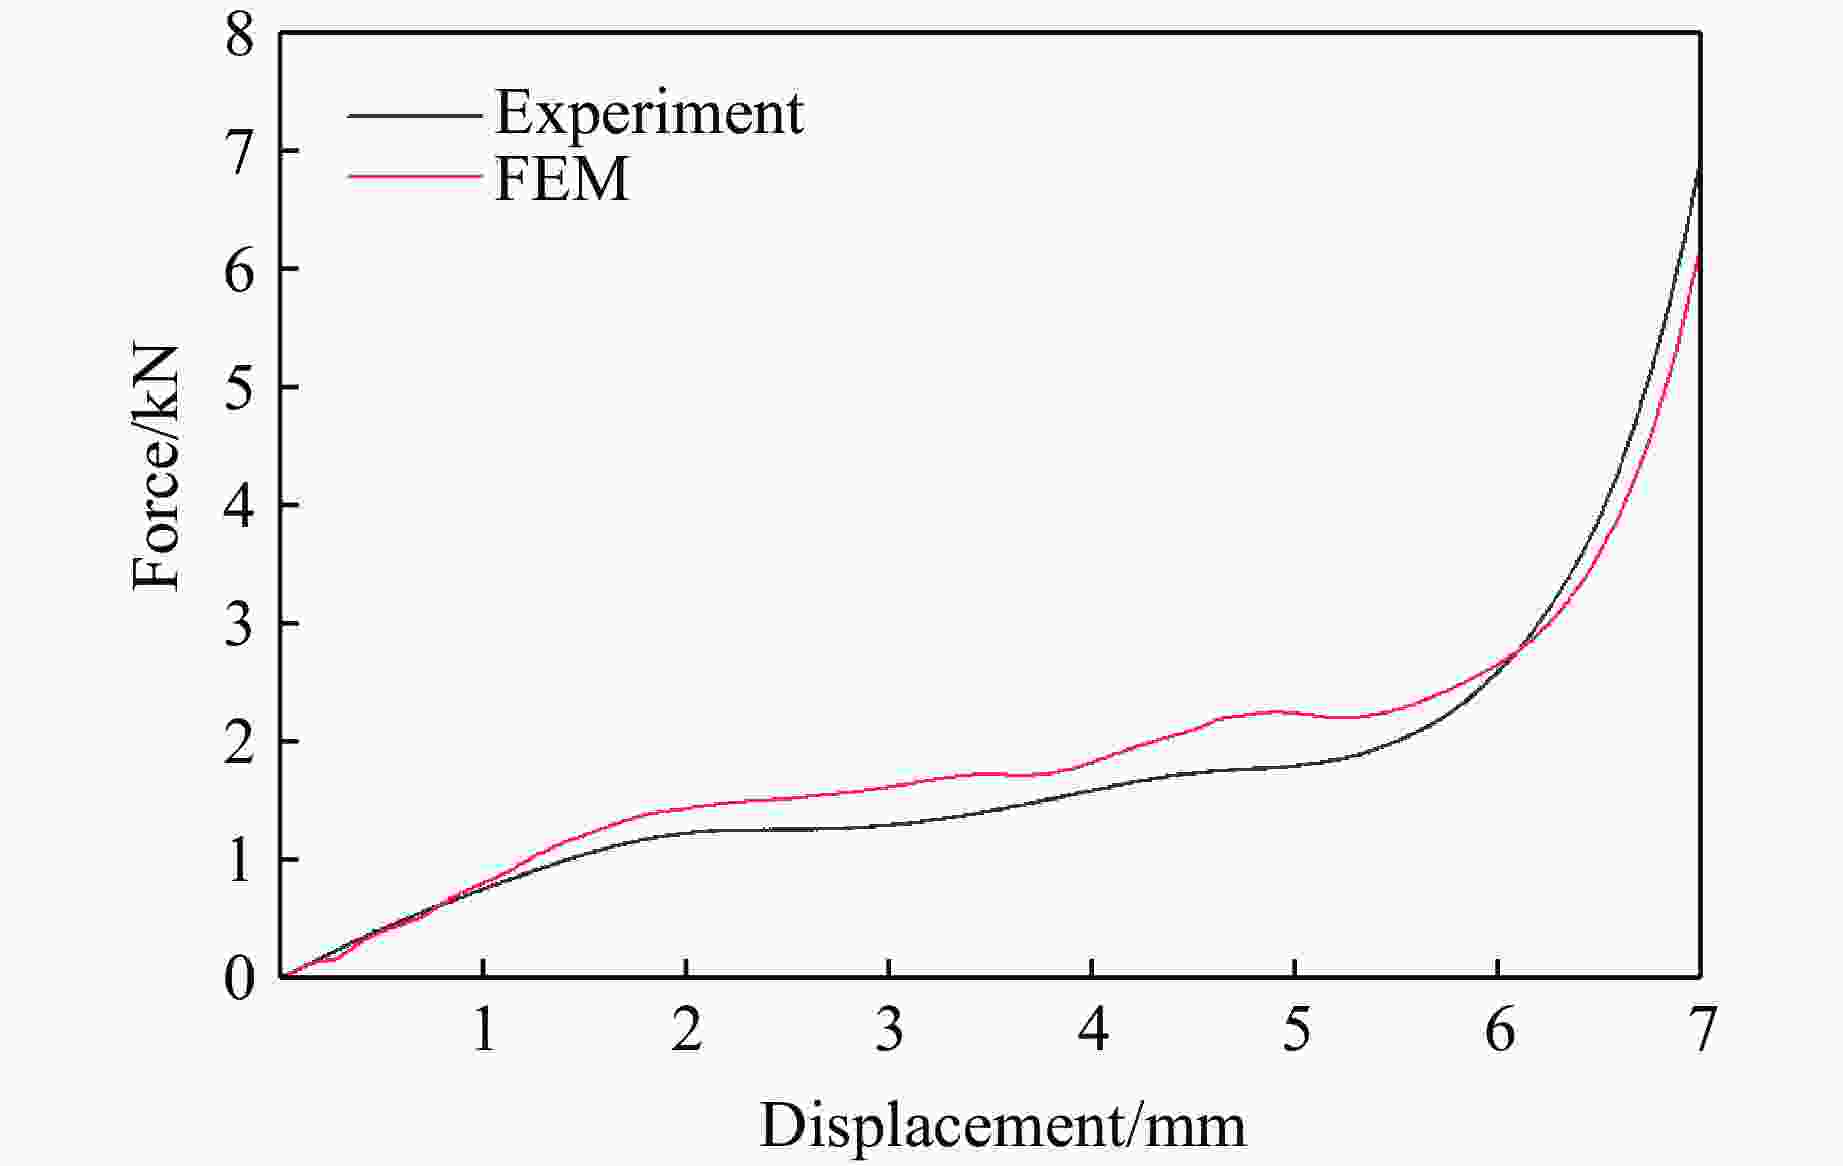
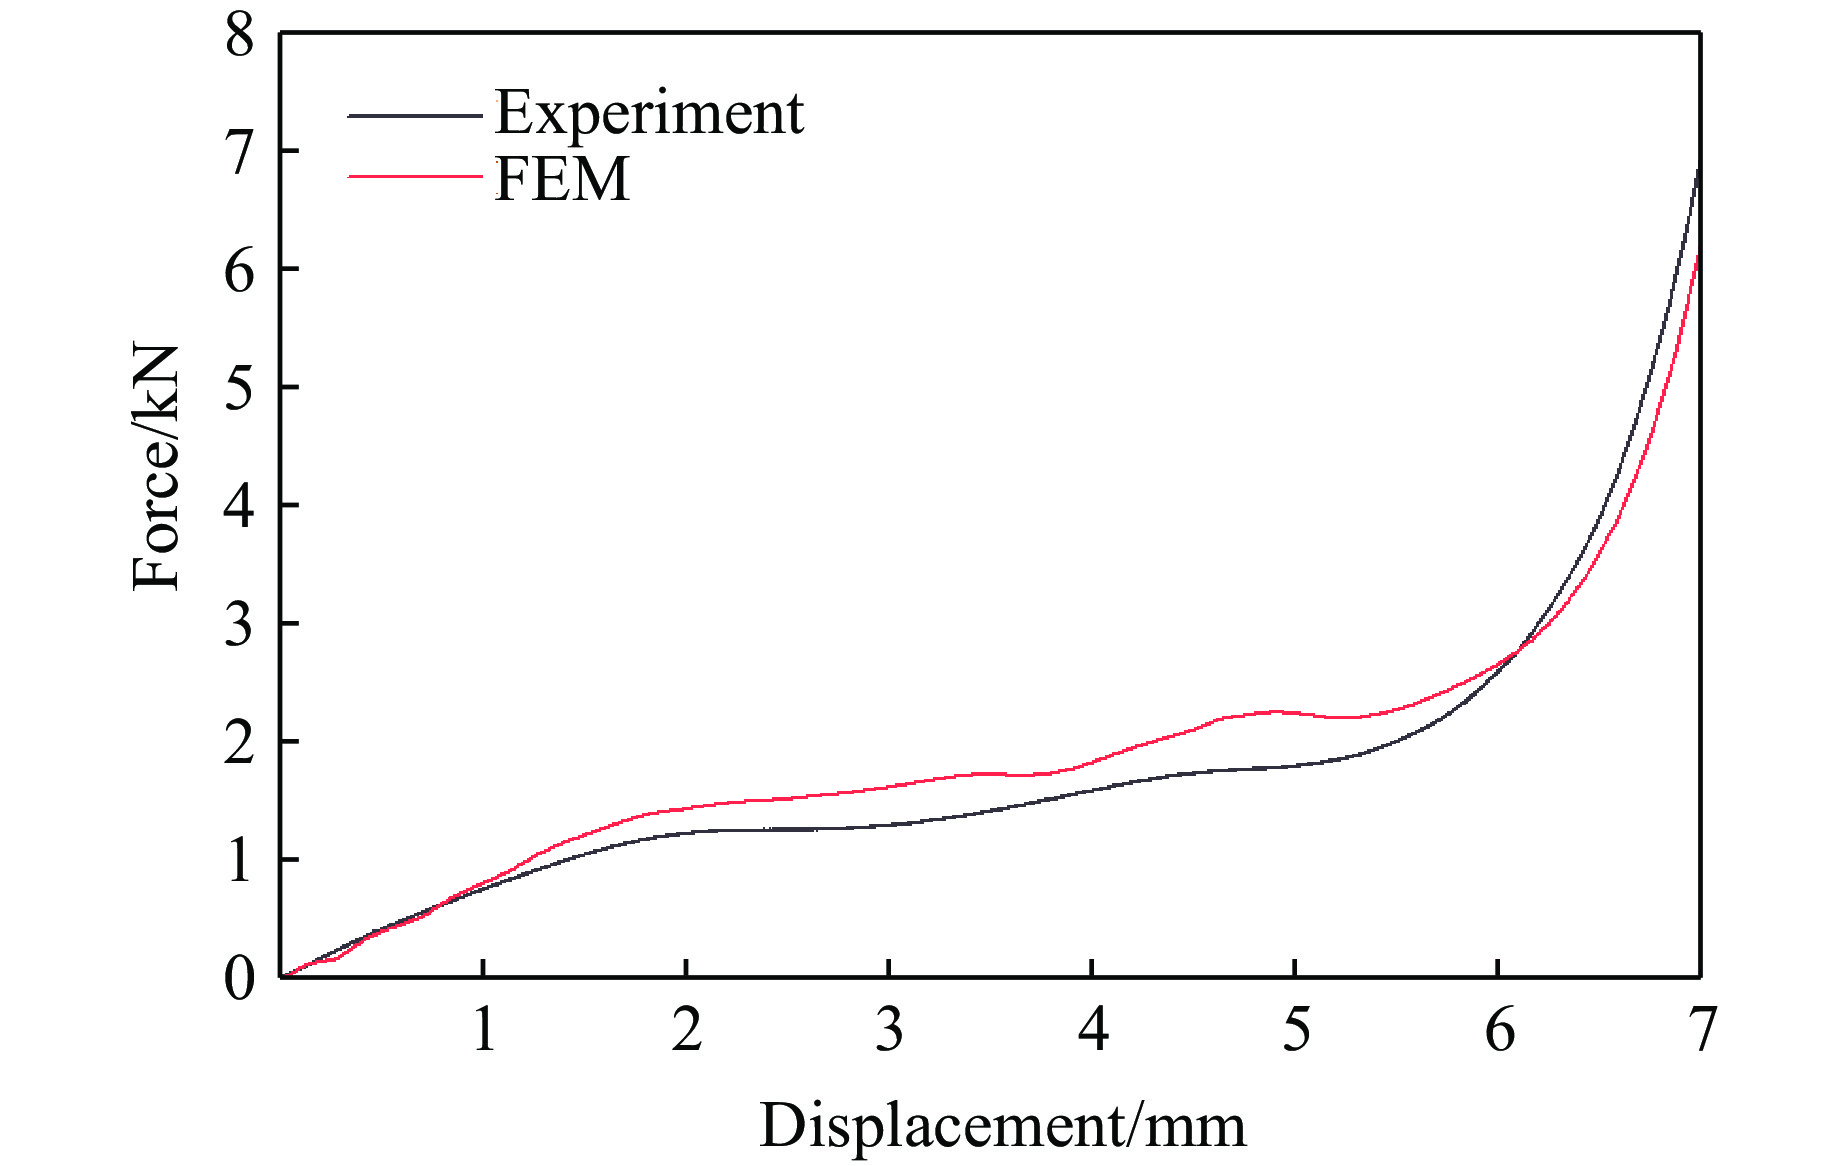
图 10 M-1试样的实验与有限元模拟载荷-位移曲线对比
Figure 10. Comparison of experimental and finite element simulation of force-displacement curves for M-1 specimens
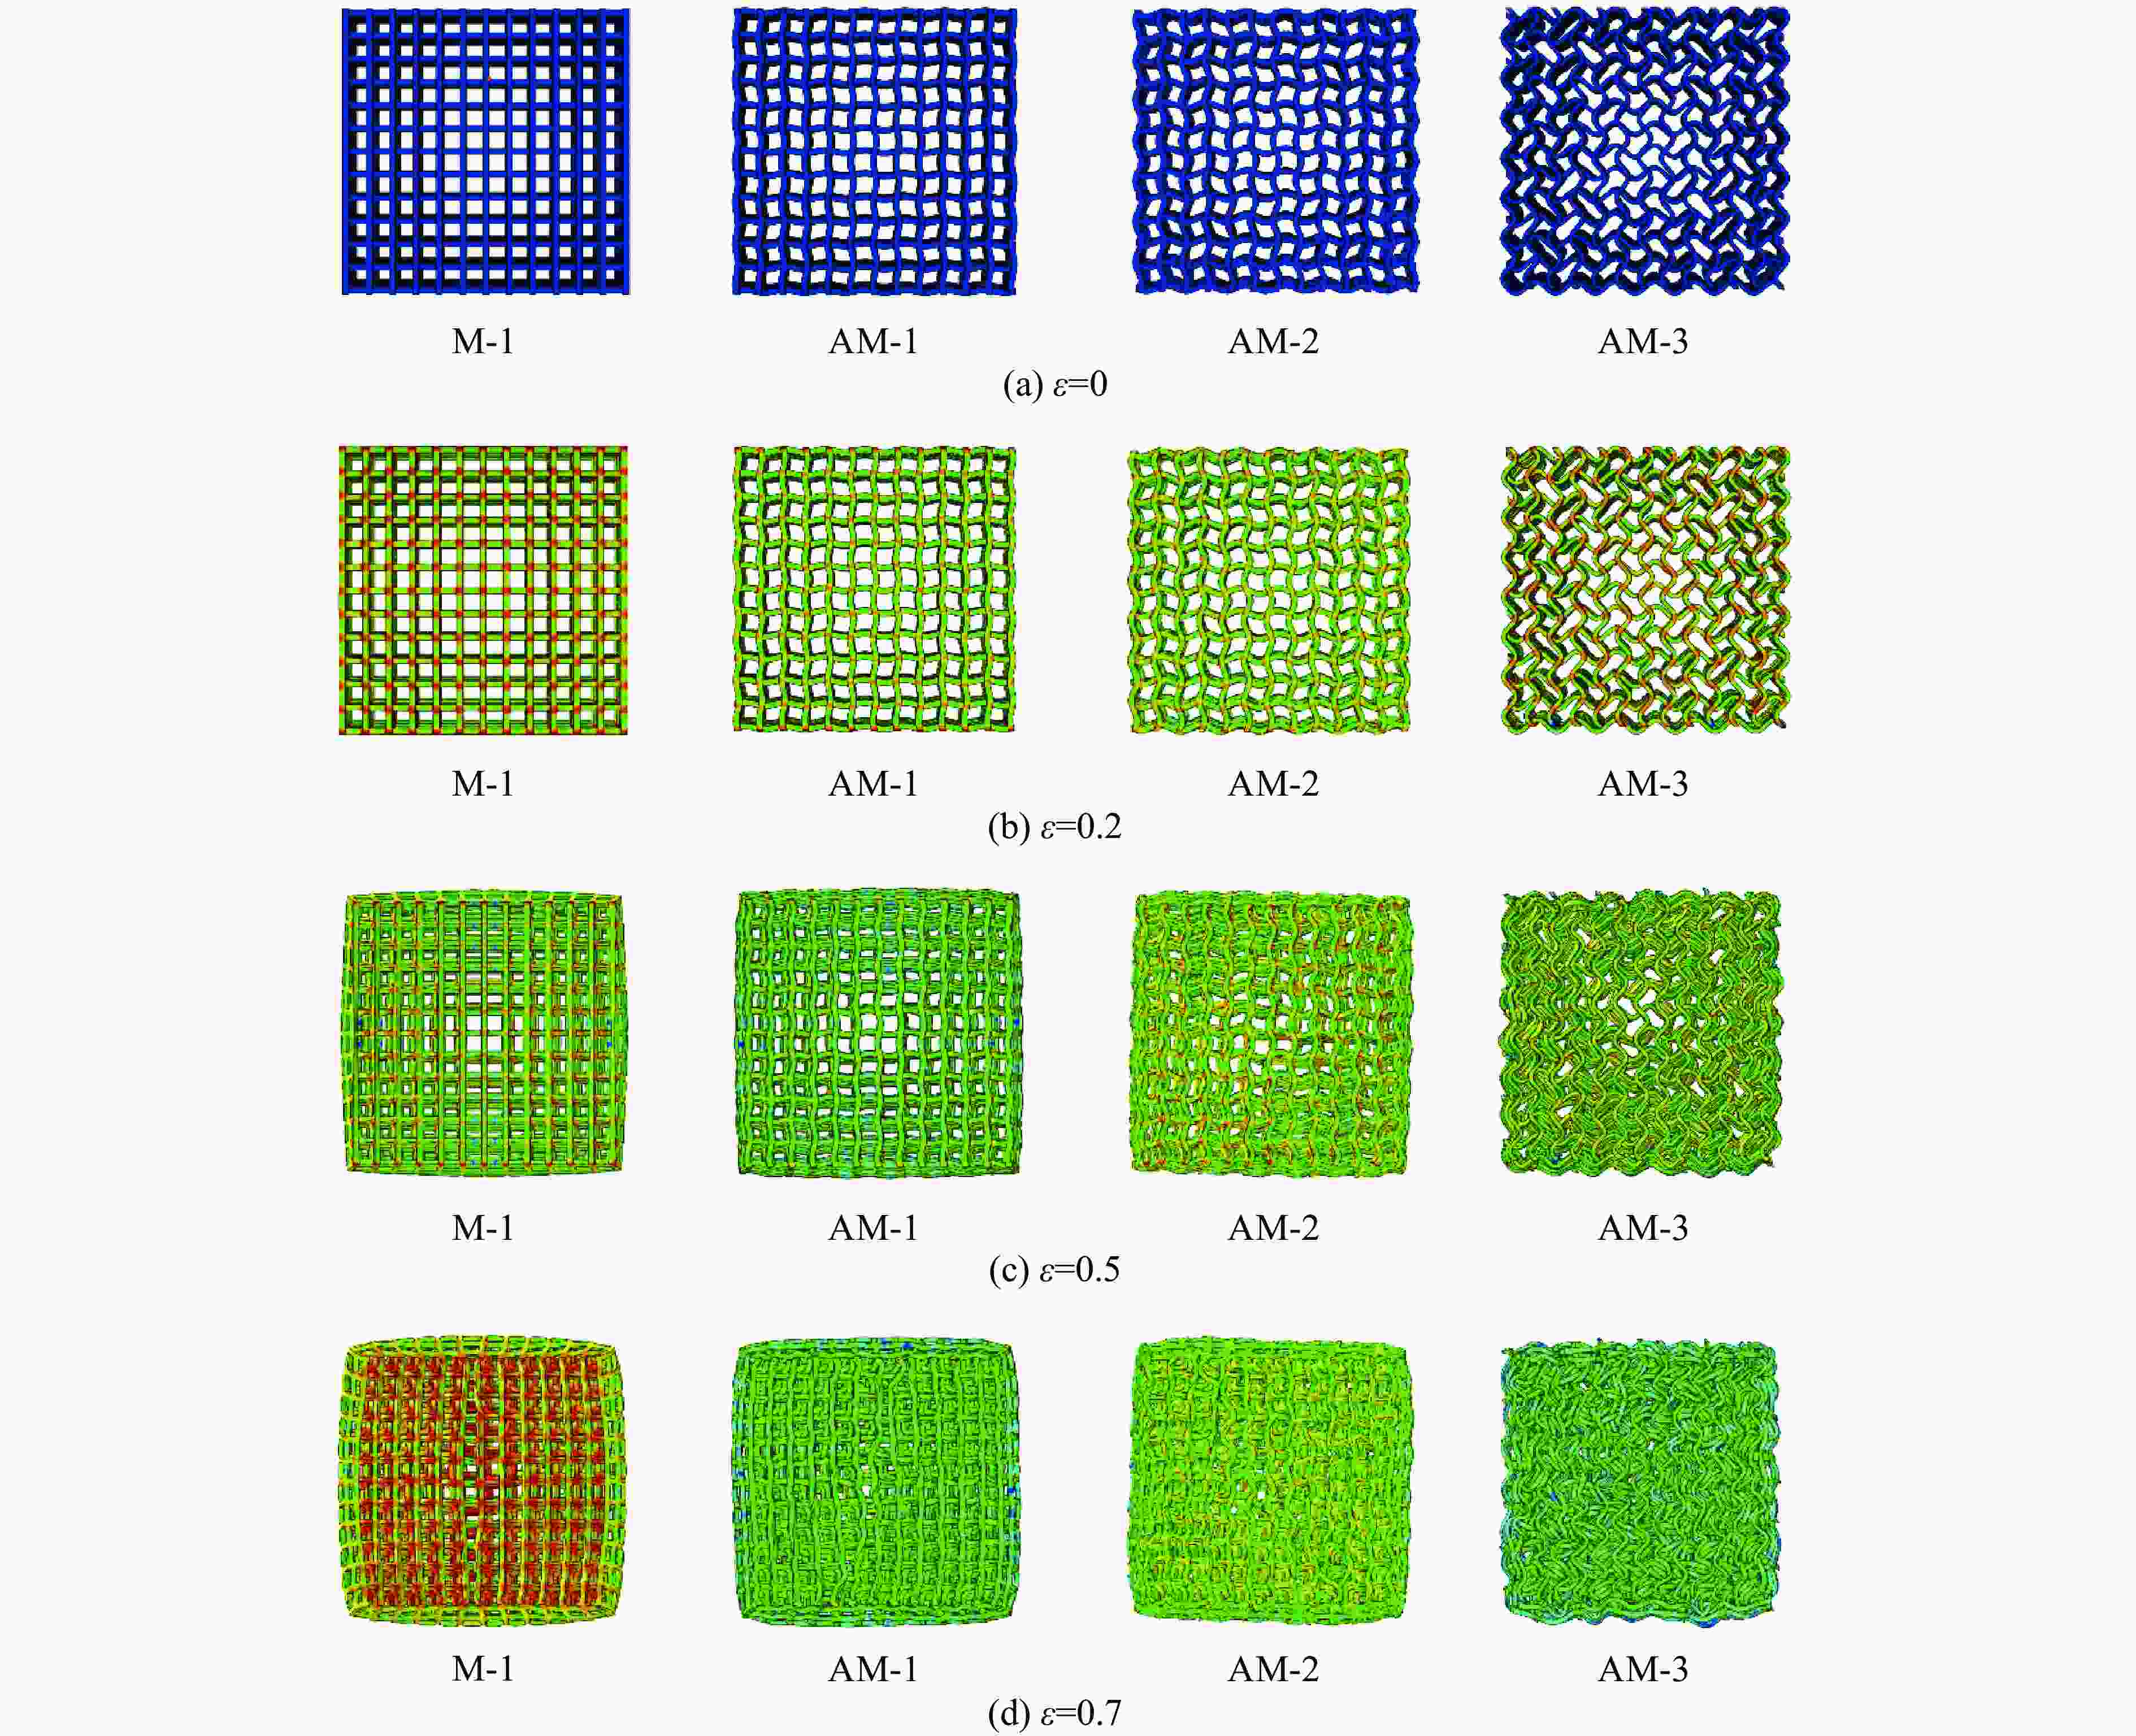
图 11 不同振幅层级结构在不同应变下的变形
Figure 11. Deformation of hierarchical structures of different amplitude under various strains
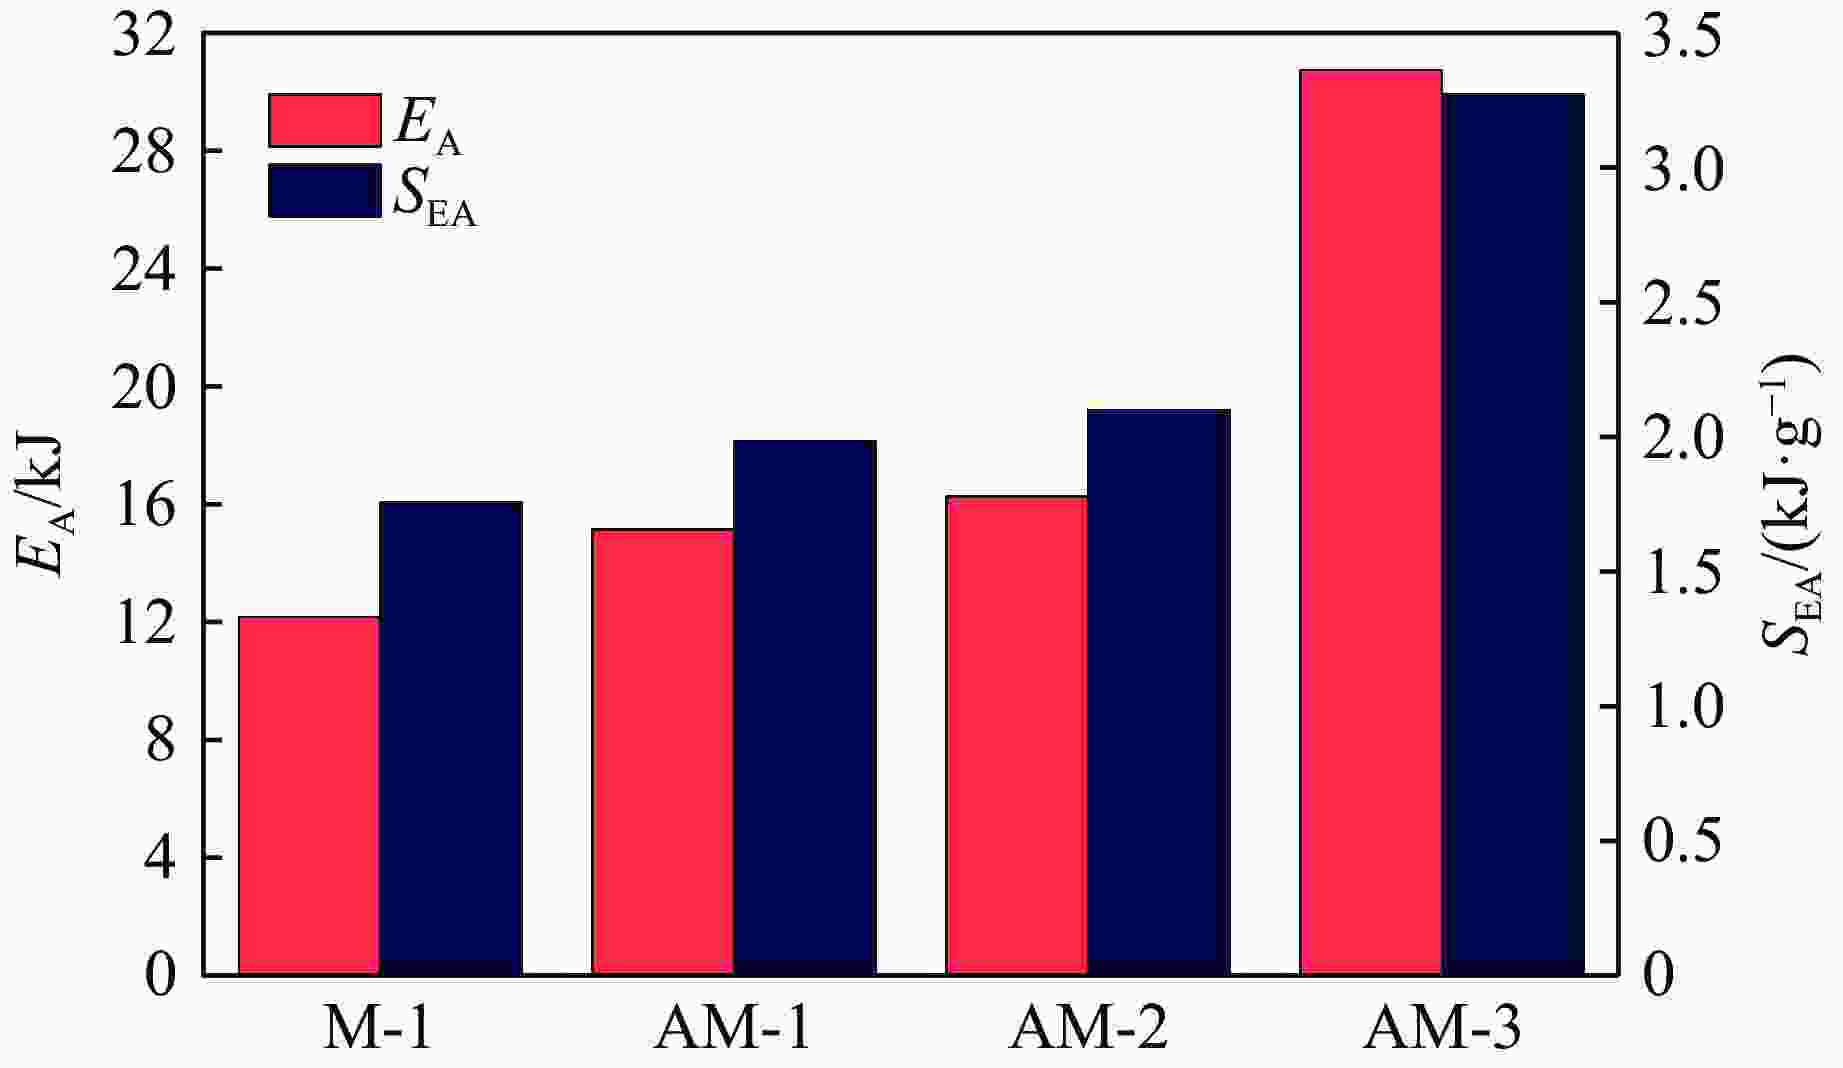
图 12 不同振幅层级结构的EA和SEA
Figure 12. EA and SEA of hierarchical structure ofdifferent amplitudes
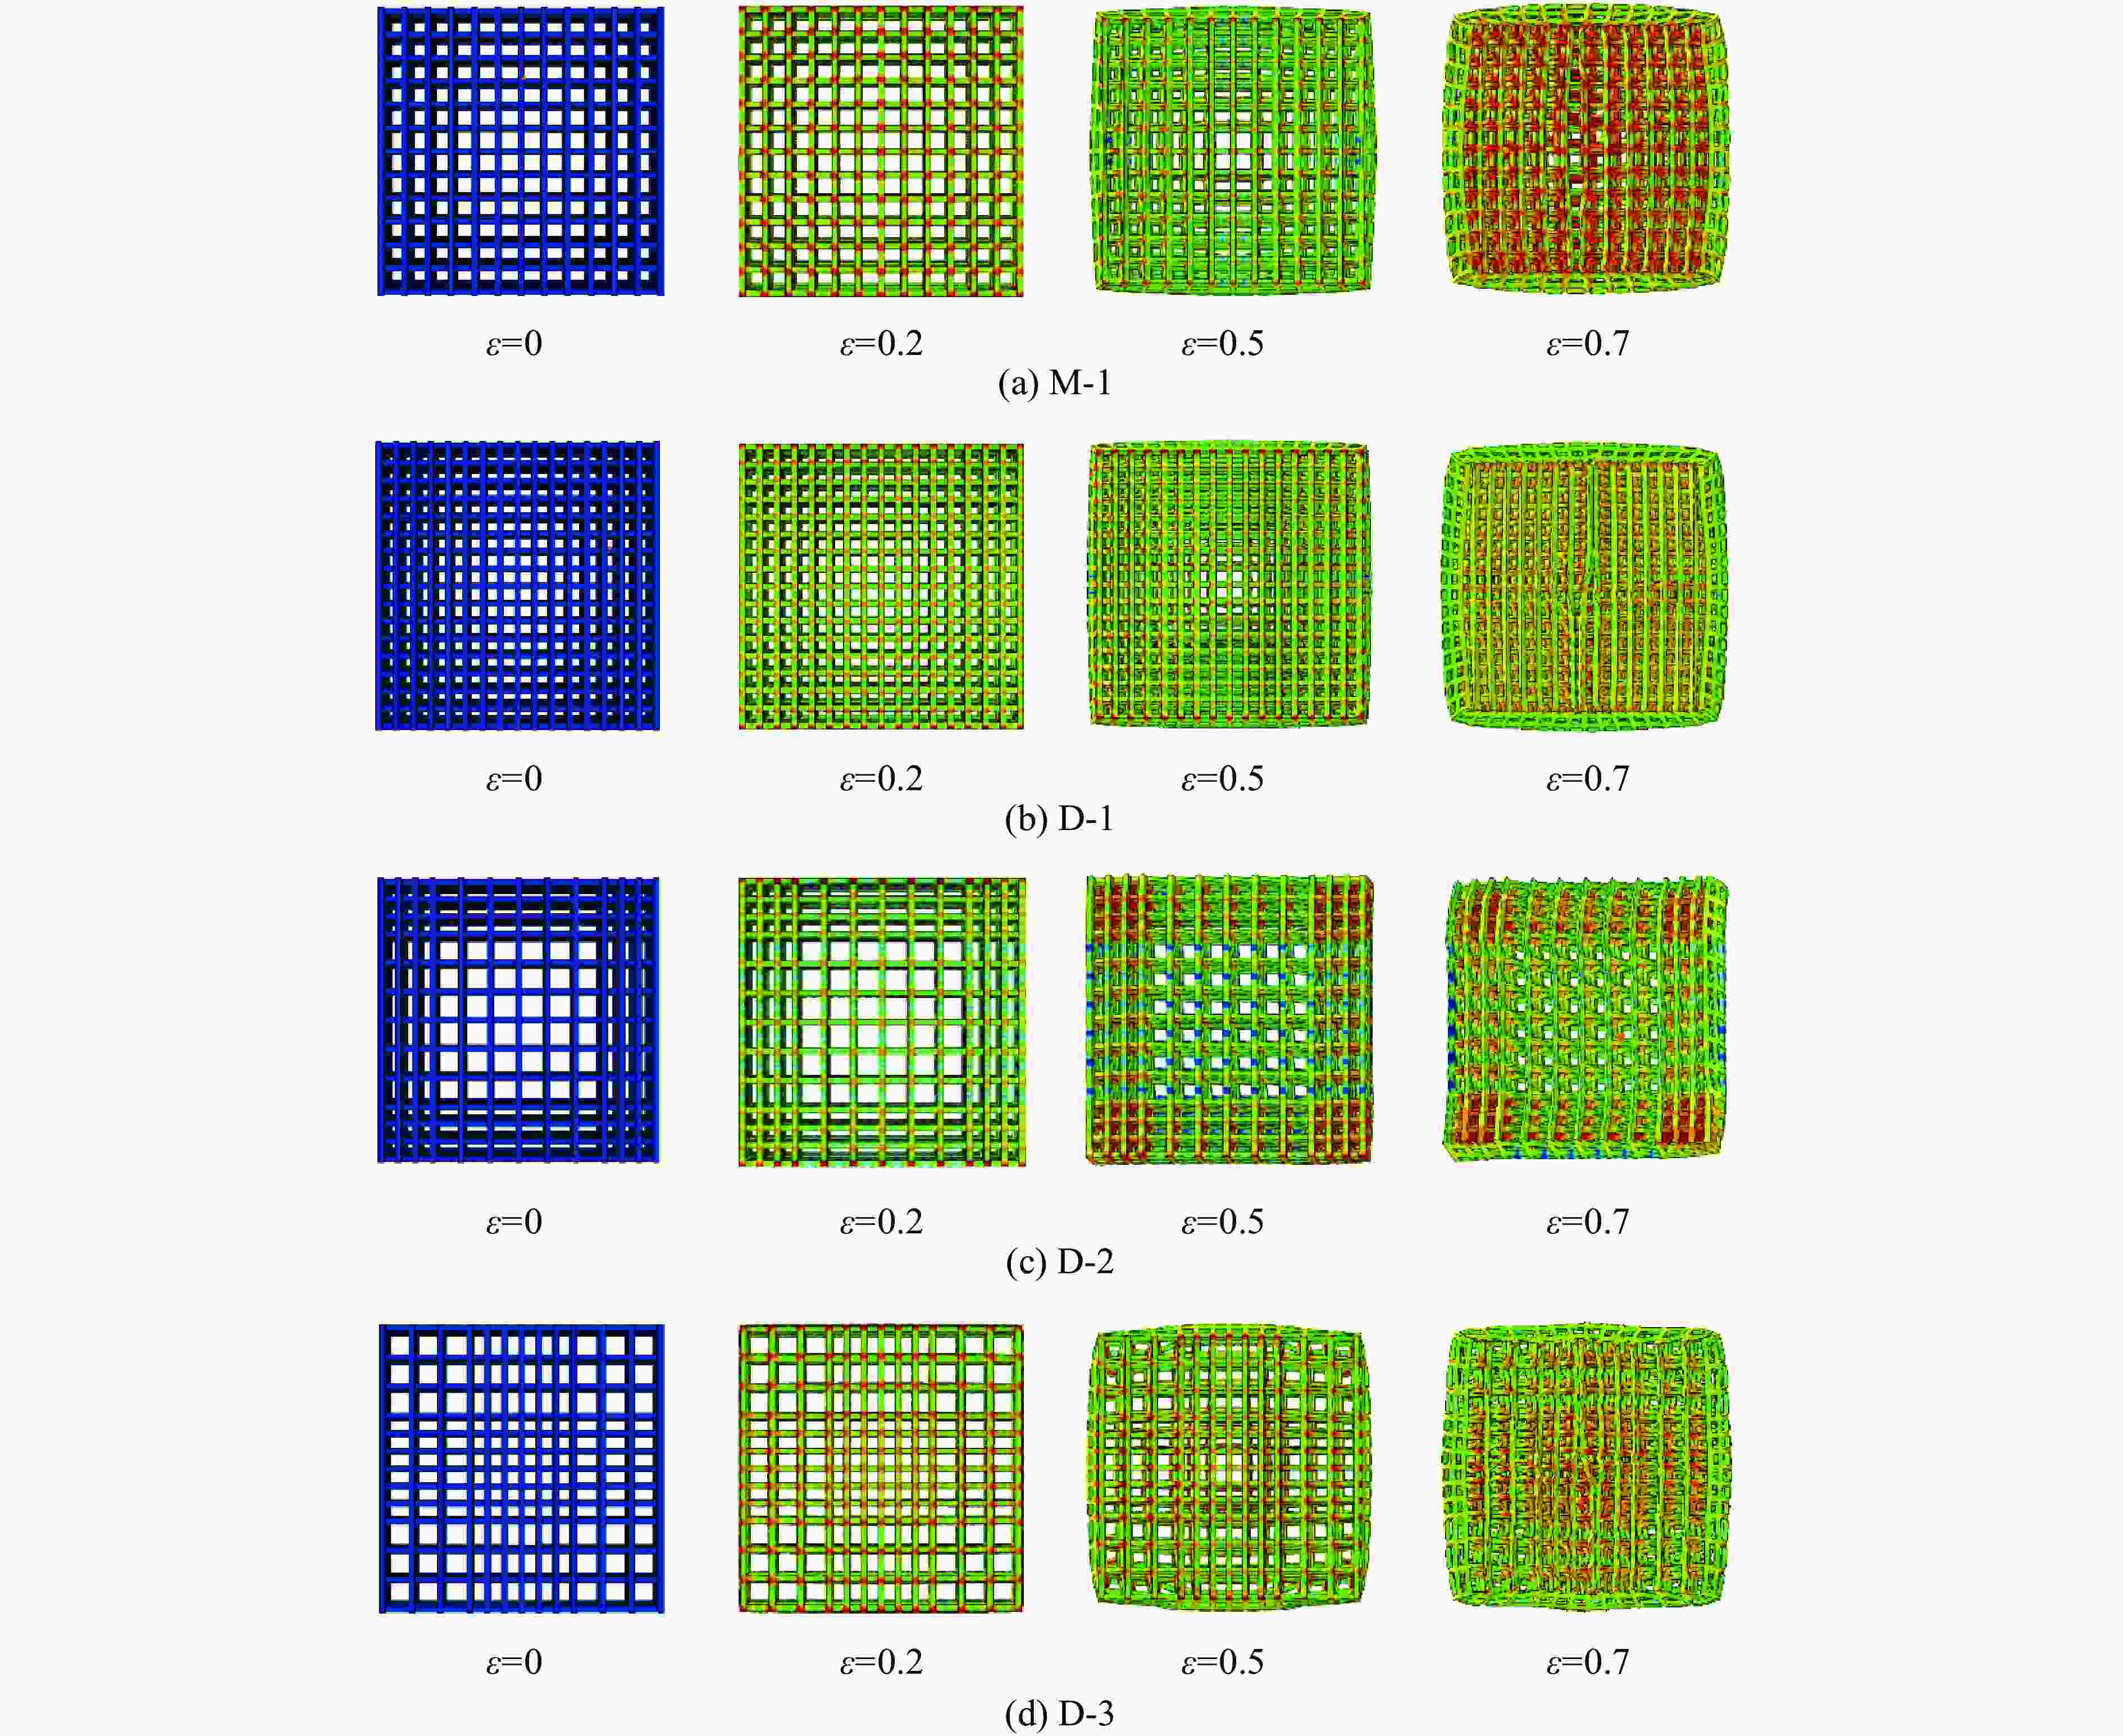
图 13 不同间距层级结构在不同应变下的变形
Figure 13. Deformation of hierarchical structures of different distance under various strains
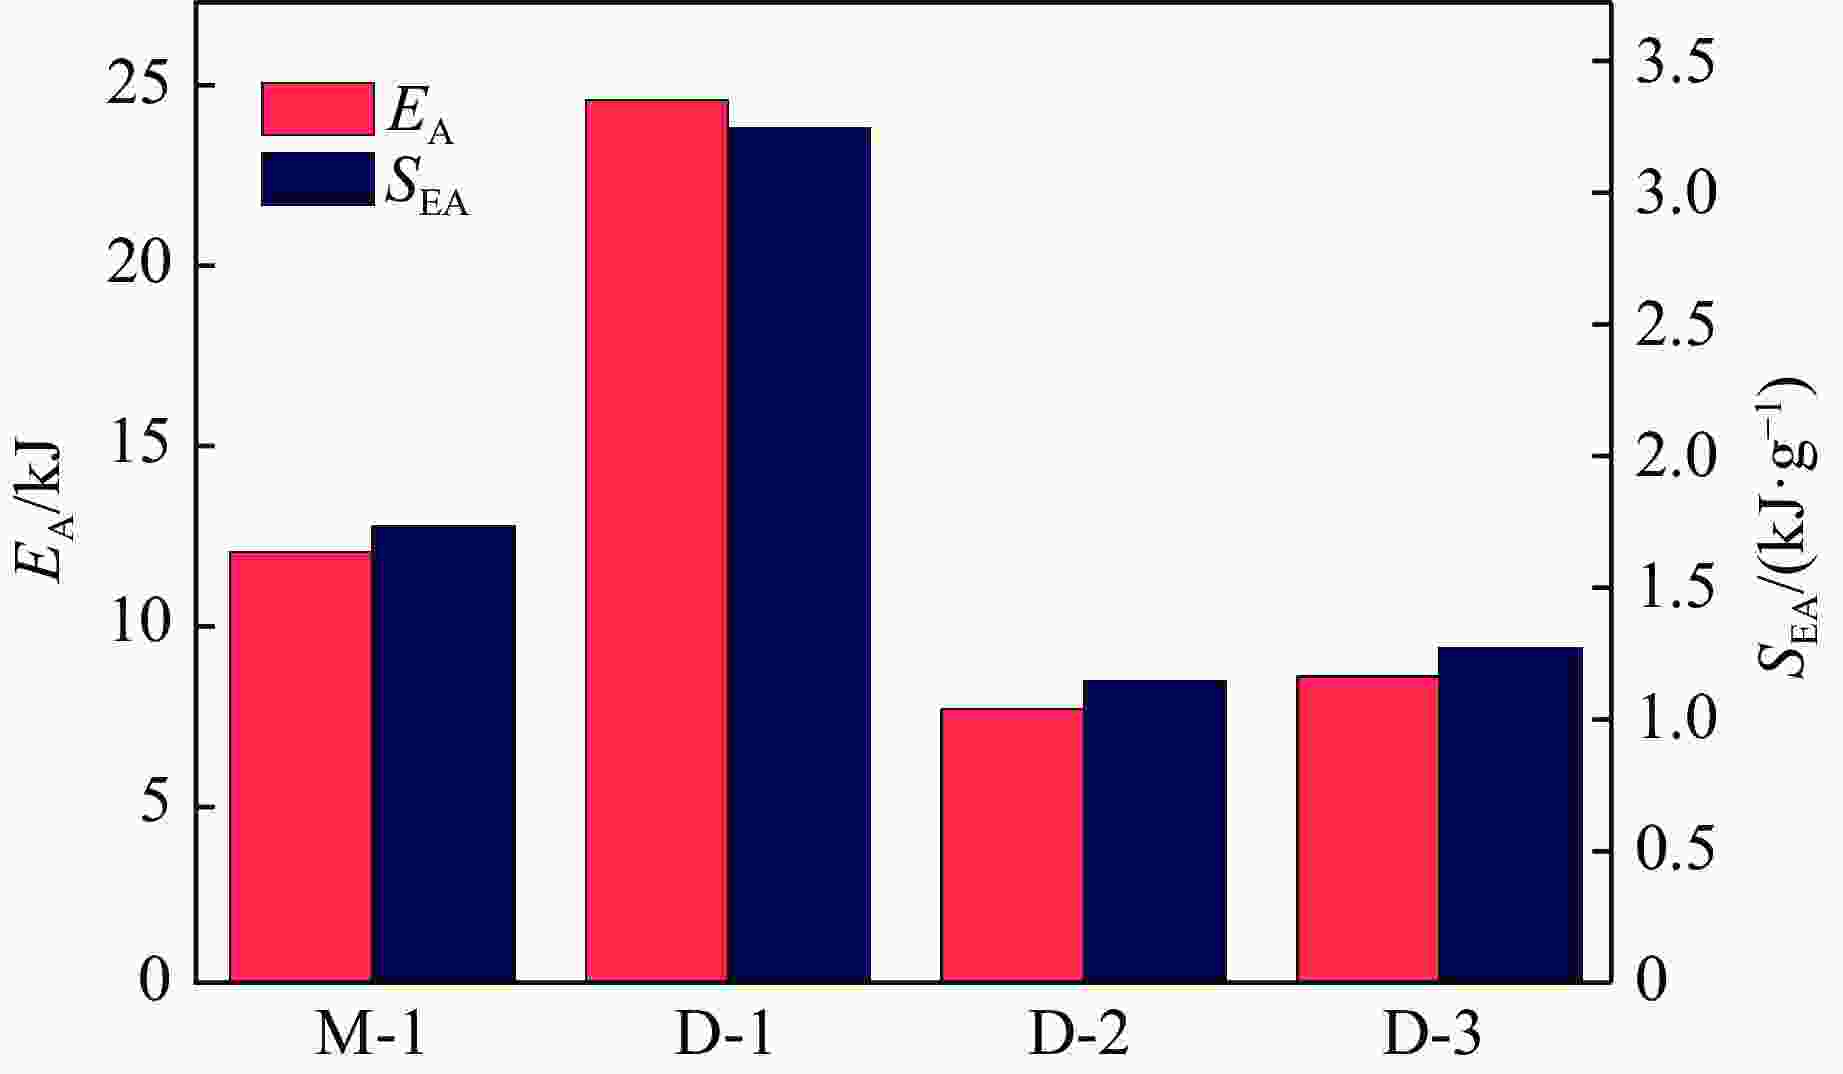
图 14 不同间距层级结构的EA和SEA
Figure 14. EA and SEA of hierarchical structure ofdifferent distance
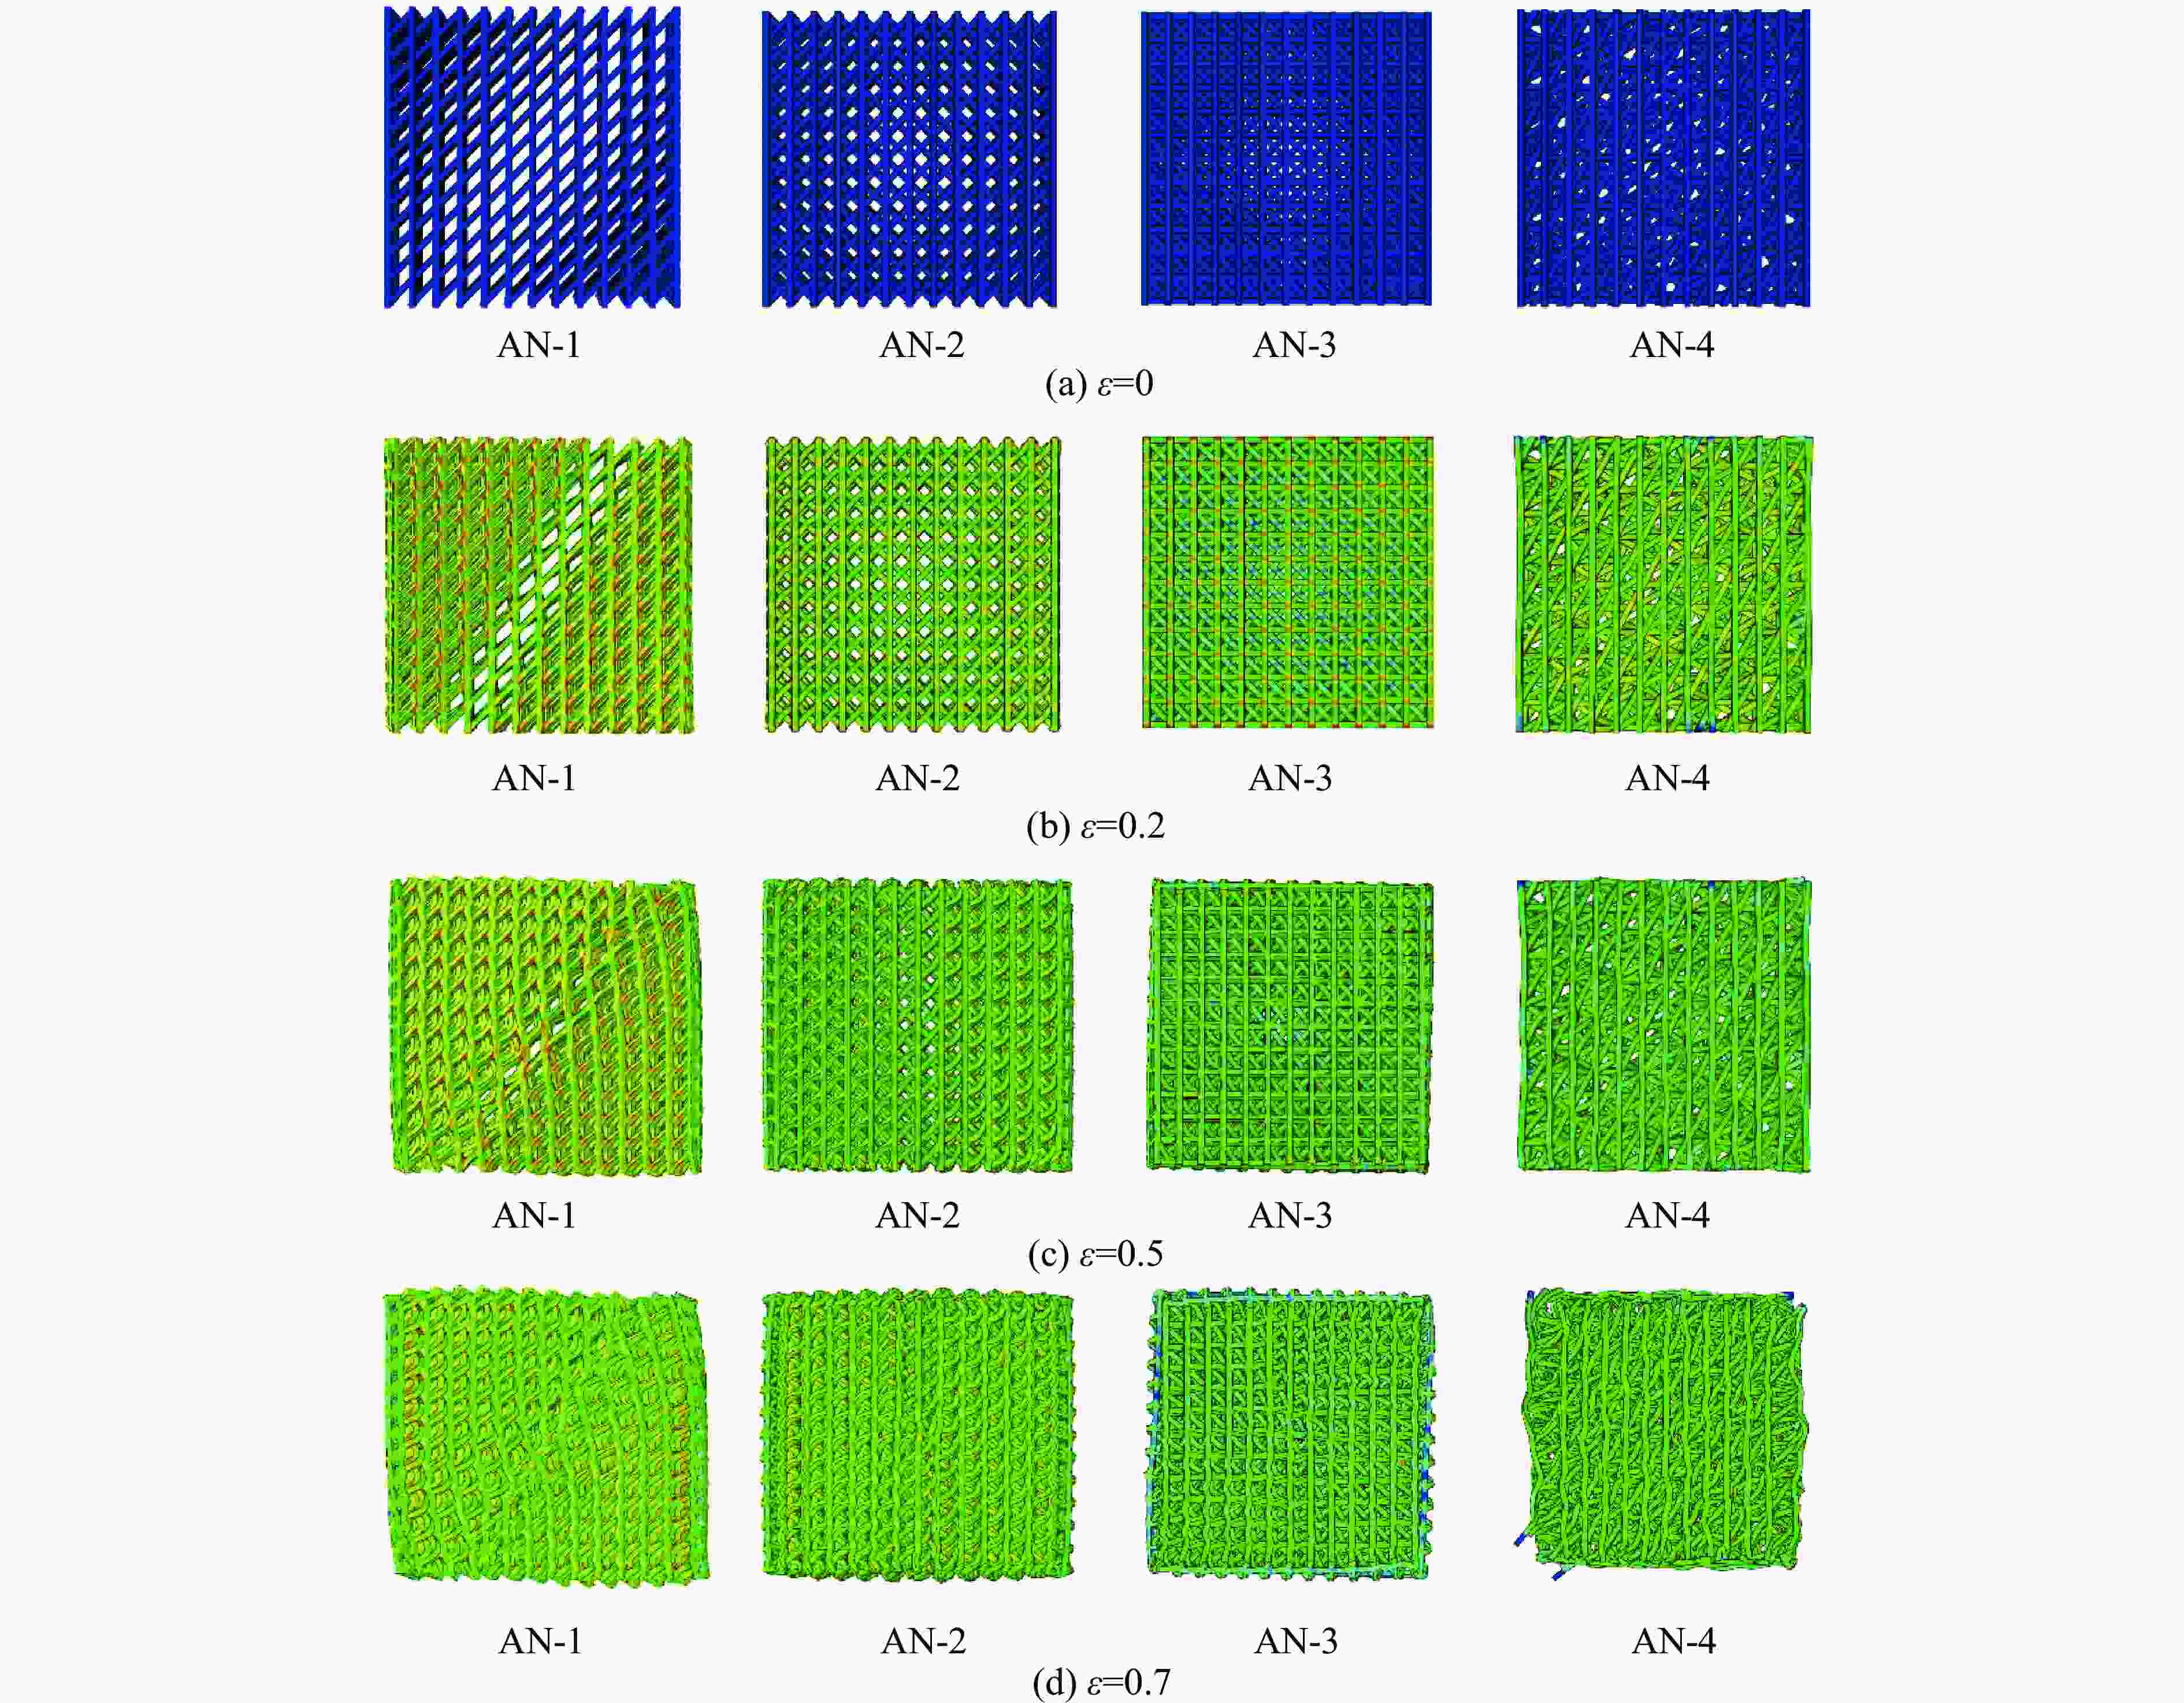
图 15 不同角度层级结构在不同应变下的变形
Figure 15. Deformation of hierarchical structures of different angle under various strains
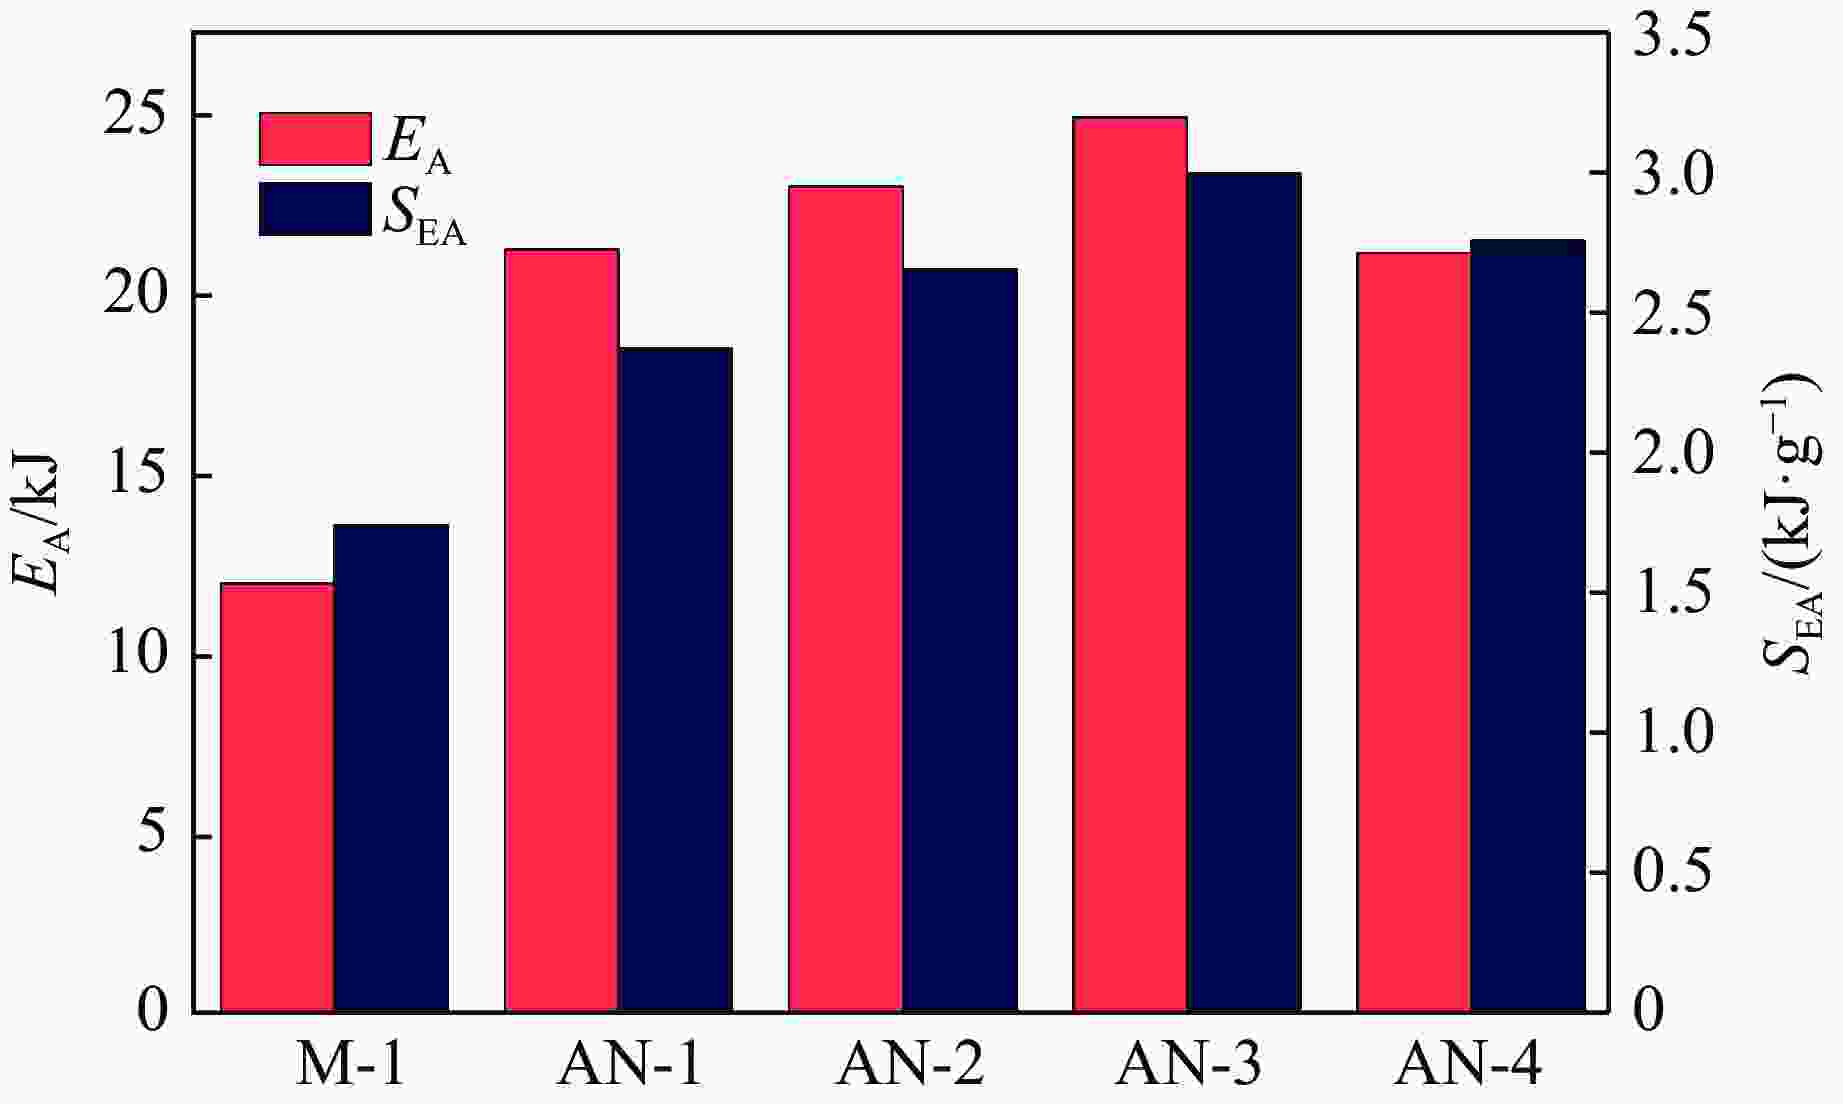
图 16 不同角度层级结构的EA和SEA
Figure 16. EA and SEA of hierarchical structure ofdifferent straight beam angles
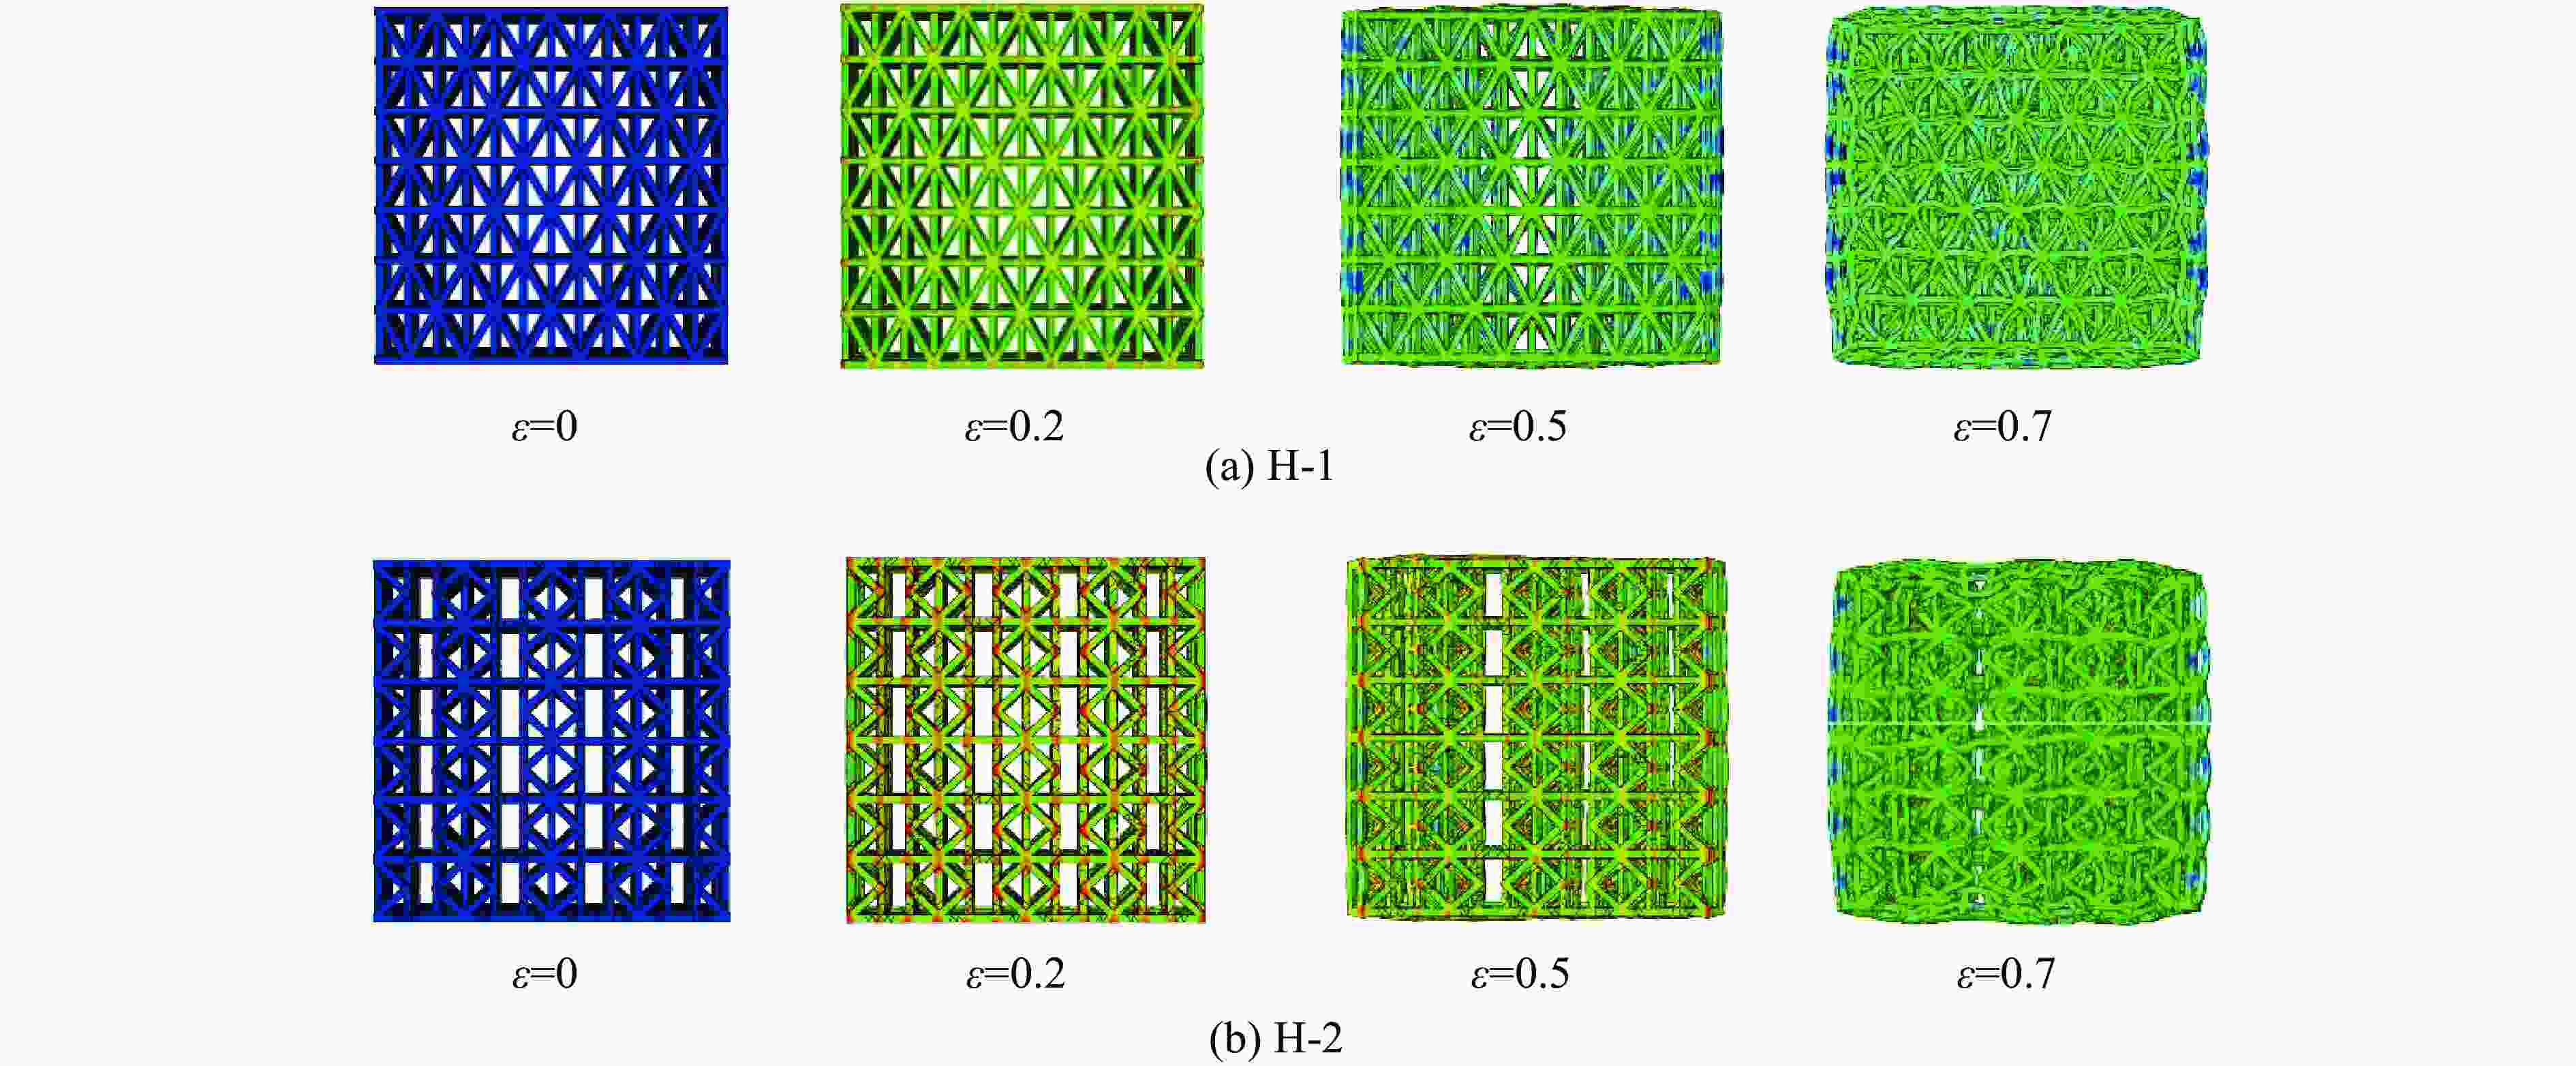
图 17 不同应变下蜂窝层级结构的变形情况
Figure 17. Deformation of honeycomb hierarchical structures under various strains
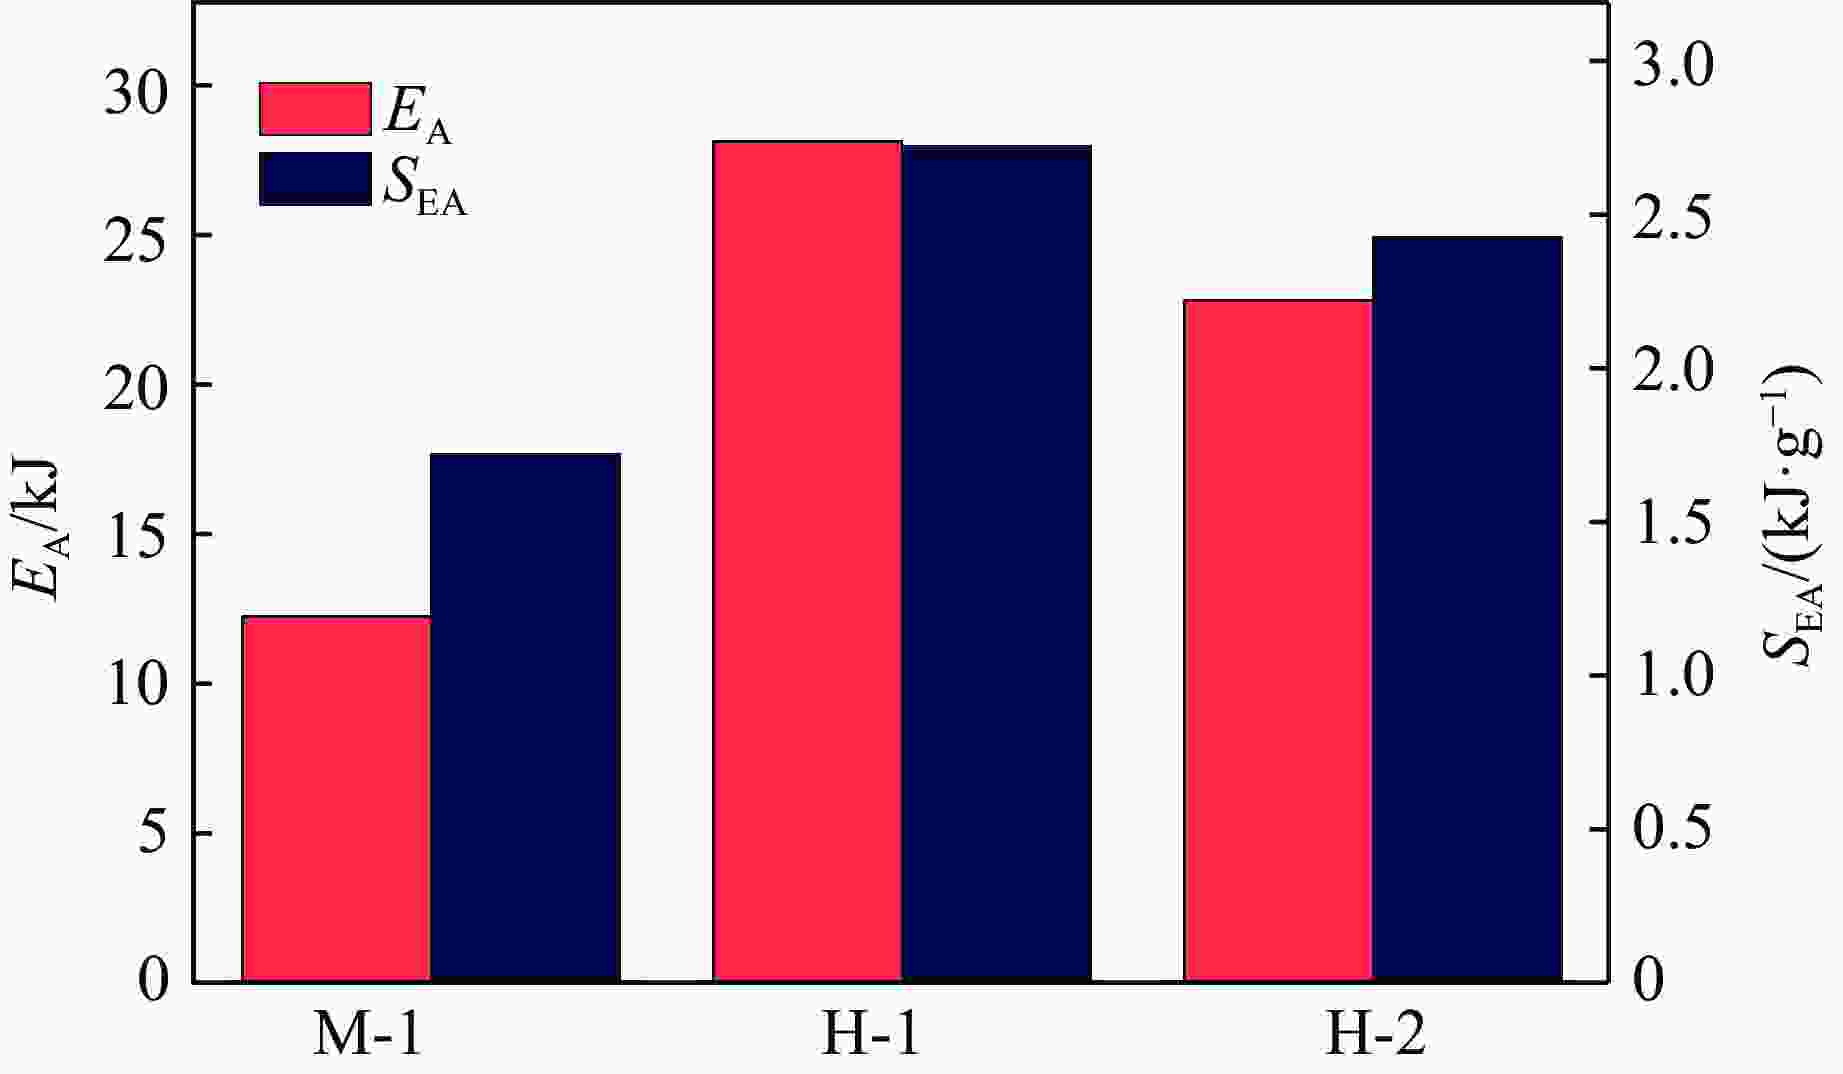
图 18 蜂窝层级结构的EA和SEA
Figure 18. EA and SEA of hierarchical structure with honeycomb structure layer
表 1 4种设计方法获得的几何模型的具体结构特征
Table 1. Specific structural features of geometric models obtained by four design methods
Model Specific structural features Distance/mm Amplitude/mm Angle/(º) M-1 3 0 0, 90 AM-1 3 0.25 0, 90 AM-2 3 0.50 0, 90 AM-3 3 1.00 0, 90 D-1 2 0 0, 90 D-2 2-4-2 0 0, 90 D-3 4-2-4 0 0, 90 AN-1 0 0, 45 AN-2 0 0, 45, 135 AN-3 0 0, 90, 45, 135 AN-4 0 0, 30, 60, 90 H-1 Honeycomb structure layer: equilateral triangle H-2 Honeycomb structure layer: re-entrant  下载: 导出CSV
表 2 打印试样的质量
Table 2. Mass of the 3D printed sample
Model Mass/g Model Mass/g M-1 6.92 AN-1 9.01 AM-1 7.63 AN-2 8.72 AM-2 7.74 AN-3 8.38 AM-3 9.39 AN-4 7.73 D-1 9.26 H-1 10.05 D-2 6.66 H-2 9.15 D-3 6.71
下载: 导出CSV
-
[1] 吴林志, 熊健, 马力, 等. 新型复合材料点阵结构的研究进展 [J]. 力学进展, 2012, 42(1): 41–67. doi: 10.6052/1000-0992-2012-1-lxjzJ2011-095WU L Z, XIONG J, MA L, et al. Processes in the study on novel composite sandwich panels with lattice truss cores [J]. Advances in Mechanics, 2012, 42(1): 41–67. doi: 10.6052/1000-0992-2012-1-lxjzJ2011-095 [2] MENG Z J, HE J K, CAI Z H, et al. Design and additive manufacturing of flexible polycaprolactone scaffolds with highly-tunable mechanical properties for soft tissue engineering [J]. Materials & Design, 2020, 189: 108508. doi: 10.1016/j.matdes.2020.108508 [3] WEEGER O, BODDETI N, YEUNG S K, et al. Digital design and nonlinear simulation for additive manufacturing of soft lattice structures [J]. Additive Manufacturing, 2019, 25: 39–49. doi: 10.1016/j.addma.2018.11.003 [4] VASILIEV V V, RAZIN A F. Anisogrid composite lattice structures for spacecraft and aircraft applications [J]. Composite Structures, 2006, 76(1/2): 182–189. doi: 10.1016/j.compstruct.2006.06.025 [5] LAI C Q, DARAIO C. Highly porous microlattices as ultrathin and efficient impact absorbers [J]. International Journal of Impact Engineering, 2018, 120: 138–149. doi: 10.1016/j.ijimpeng.2018.05.014 [6] XUE R, CUI X G, ZHANG P, et al. Mechanical design and energy absorption performances of novel dual scale hybrid plate-lattice mechanical metamaterials [J]. Extreme Mechanics Letters, 2020, 40: 100918. doi: 10.1016/j.eml.2020.100918 [7] ZHANG H, GUO X G, WU J, et al. Soft mechanical metamaterials with unusual swelling behavior and tunable stress-strain curves [J]. Science Advances, 2018, 4(6): eaar8535. doi: 10.1126/sciadv.aar8535 [8] SEEPERSAD C C, ALLEN J K, MCDOWELL D L, et al. Robust design of cellular materials with topological and dimensional imperfections [J]. Journal of Mechanical Design, 2006, 128(6): 1285–1297. doi: 10.1115/1.2338575 [9] BONATTI C, MOHR D. Large deformation response of additively-manufactured FCC metamaterials: from octet truss lattices towards continuous shell mesostructures [J]. International Journal of Plasticity, 2017, 92: 122–147. doi: 10.1016/j.ijplas.2017.02.003 [10] WANG C, GU X J, ZHU J H, et al. Concurrent design of hierarchical structures with three-dimensional parameterized lattice microstructures for additive manufacturing [J]. Structural and Multidisciplinary Optimization, 2020, 61(3): 869–894. doi: 10.1007/s00158-019-02408-2 [11] YIN S, LI J N, CHEN H Y, et al. Design and strengthening mechanisms in hierarchical architected materials processed using additive manufacturing [J]. International Journal of Mechanical Sciences, 2018, 149: 150–163. doi: 10.1016/j.ijmecsci.2018.09.038 [12] CHEN X Y, JI Q X, WEI J Z, et al. Light-weight shell-lattice metamaterials for mechanical shock absorption [J]. International Journal of Mechanical Sciences, 2020, 169: 105288. doi: 10.1016/j.ijmecsci.2019.105288 [13] MANSOUR M T, TSONGAS K, TZETZIS D, et al. The in-plane compression performance of hierarchical honeycomb additive manufactured structures [J]. IOP Conference Series: Materials Science and Engineering, 2019, 564: 012015. doi: 10.1088/1757-899X/564/1/012015 [14] SIACOR F D C, CHEN Q Y, ZHAO J Y, et al. On the additive manufacturing (3D printing) of viscoelastic materials and flow behavior: from composites to food manufacturing [J]. Additive Manufacturing, 2021, 45: 102043. doi: 10.1016/j.addma.2021.102043 [15] 廉艳平, 王潘丁, 高杰, 等. 金属增材制造若干关键力学问题研究进展 [J]. 力学进展, 2021, 51(3): 648–701. doi: 10.6052/1000-0992-21-037LIAN Y P, WANG P D, GAO J, et al. Fundamental mechanics problems in metal additive manufacturing: a state-of-art review [J]. Advances in Mechanics, 2021, 51(3): 648–701. doi: 10.6052/1000-0992-21-037 [16] WANG S L, ZHANG M, WANG Y, et al. Experimental studies on quasi-static axial crushing of additively-manufactured PLA random honeycomb-filled double circular tubes [J]. Composite Structures, 2021, 261: 113553. doi: 10.1016/j.compstruct.2021.113553 [17] 李腾, 邓庆田, 李新波, 等. 多孔柱准静态压缩力学行为和吸能特性分析 [J]. 塑性工程学报, 2022, 29(2): 204–211. doi: 10.3969/j.issn.1007-2012.2022.02.029LI T, DENG Q T, LI X B, et al. Analysis of quasi-static compression mechanical behavior and energy absorption characteristics of porous columns [J]. Journal of Plasticity Engineering, 2022, 29(2): 204–211. doi: 10.3969/j.issn.1007-2012.2022.02.029 [18] TAN C L, ZOU J, LI S, et al. Additive manufacturing of bio-inspired multi-scale hierarchically strengthened lattice structures [J]. International Journal of Machine Tools and Manufacture, 2021, 167: 103764. doi: 10.1016/j.ijmachtools.2021.103764 [19] YAN D J, CHANG J H, ZHANG H, et al. Soft three-dimensional network materials with rational bio-mimetic designs [J]. Nature Communications, 2020, 11(1): 1180. doi: 10.1038/s41467-020-14996-5 [20] KUMAR A, VERMA S, JENG J Y. Supportless lattice structures for energy absorption fabricated by fused deposition modeling [J]. 3D Printing and Additive Manufacturing, 2020, 7(2): 85–96. doi: 10.1089/3dp.2019.0089 [21] LIU Y B, DONG Z C, GE J R, et al. Out-of-plane impact resistance enhancement in plane lattice with curved links [J]. Journal of Applied Mechanics, 2019, 86(9): 091004. doi: 10.1115/1.4043830 [22] FENG G Z, LI S, XIAO L J, et al. Energy absorption performance of honeycombs with curved cell walls under quasi-static compression [J]. International Journal of Mechanical Sciences, 2021, 210: 106746. doi: 10.1016/j.ijmecsci.2021.106746 [23] QI J Q, LI C, TIE Y, et al. Energy absorption characteristics of origami-inspired honeycomb sandwich structures under low-velocity impact loading [J]. Materials & Design, 2021, 207: 109837. doi: 10.1016/j.matdes.2021.109837 [24] WANG P, YANG F, RU D S, et al. Additive-manufactured hierarchical multi-circular lattice structures for energy absorption application [J]. Materials & Design, 2021, 210: 110116. doi: 10.1016/j.matdes.2021.110116 -

 下载:
下载:


计量
- 文章访问数: 777
- HTML全文浏览量: 572
- PDF下载量: 55
