


Influence of Interior Ballistics for Underwater Guns with Gun-Bullet Coupling Gap
-
摘要: 为了研究枪炮全水下发射过程中枪弹耦合间隙对内弹道特性的影响,运用AUTODYN有限元仿真软件,针对滑膛水下枪枪弹耦合设置0.1 mm间隙与不设置间隙两种情况的内弹道过程进行了数值模拟;采用21、25和30 g装药量对水下枪全水下带间隙发射内弹道过程进行了仿真分析,获得了膛压、射弹速度以及过间隙燃气射流在内弹道过程中组分、压力与速度的分布规律;并设计了实弹射击实验用于验证仿真结果。仿真和实验结果表明,合适的枪炮耦合间隙能够有效地提高水下枪发射性能。当枪弹耦合设置0.1 mm间隙时,采用3种装药量发射均能产生弹前气幕,内弹道过程膛压下降明显,弹丸炮口速度提升较为显著,有利于产生稳定的超空泡包裹弹体,使其在水下运动时所受阻力大大降低,从而增加射弹水下行程。Abstract: In this paper, the influence of the gun-bullet coupling gap on the internal ballistic characteristics during the full underwater launch of the gun have been studied. The internal ballistic process of setting 0.1 mm gap and no gap is simulated by AUTODYN finite element simulation software. And the internal ballistic process of underwater gun with underwater clearance is simulated using 21, 25 and 30 g propellant. The projectile velocity, pressure inside the barrel and the distribution of components, pressure and velocity of over-gap gas jets during the internal ballistic process are obtained from the simulation, and the simulation results is verified by experiment. The simulation and experimental results show that the proper gun coupling gap can effectively improve the underwater gun launch performance. When the gun-bullet coupling gap is set as 0.1 mm, the gas curtain are all obtained from the propellant with three different masses. Meanwhile, the pressure decreased obviously during the internal ballistic process, and the projectile speed at muzzle is improved significantly, which is beneficial to the production of stable supercavitation warp projectile. The resistance of the projectile moving underwater reduces greatly and the travel of the projectile increases underwater.
-

图 1 水下枪枪弹耦合带间隙发射物理模型
Figure 1. Physical model of underwater gun-bomb coupling gap launch

图 6 无间隙与间隙0.1 mm两种情况的内弹道参数变化曲线
Figure 6. Variation curves of internal ballistic parameters of the launching with no gap and 0.1 mm gap

图 7 不同装药情况下内弹道参数变化曲线
Figure 7. Variation curves of internal ballistic parameters of the launching with different propellants

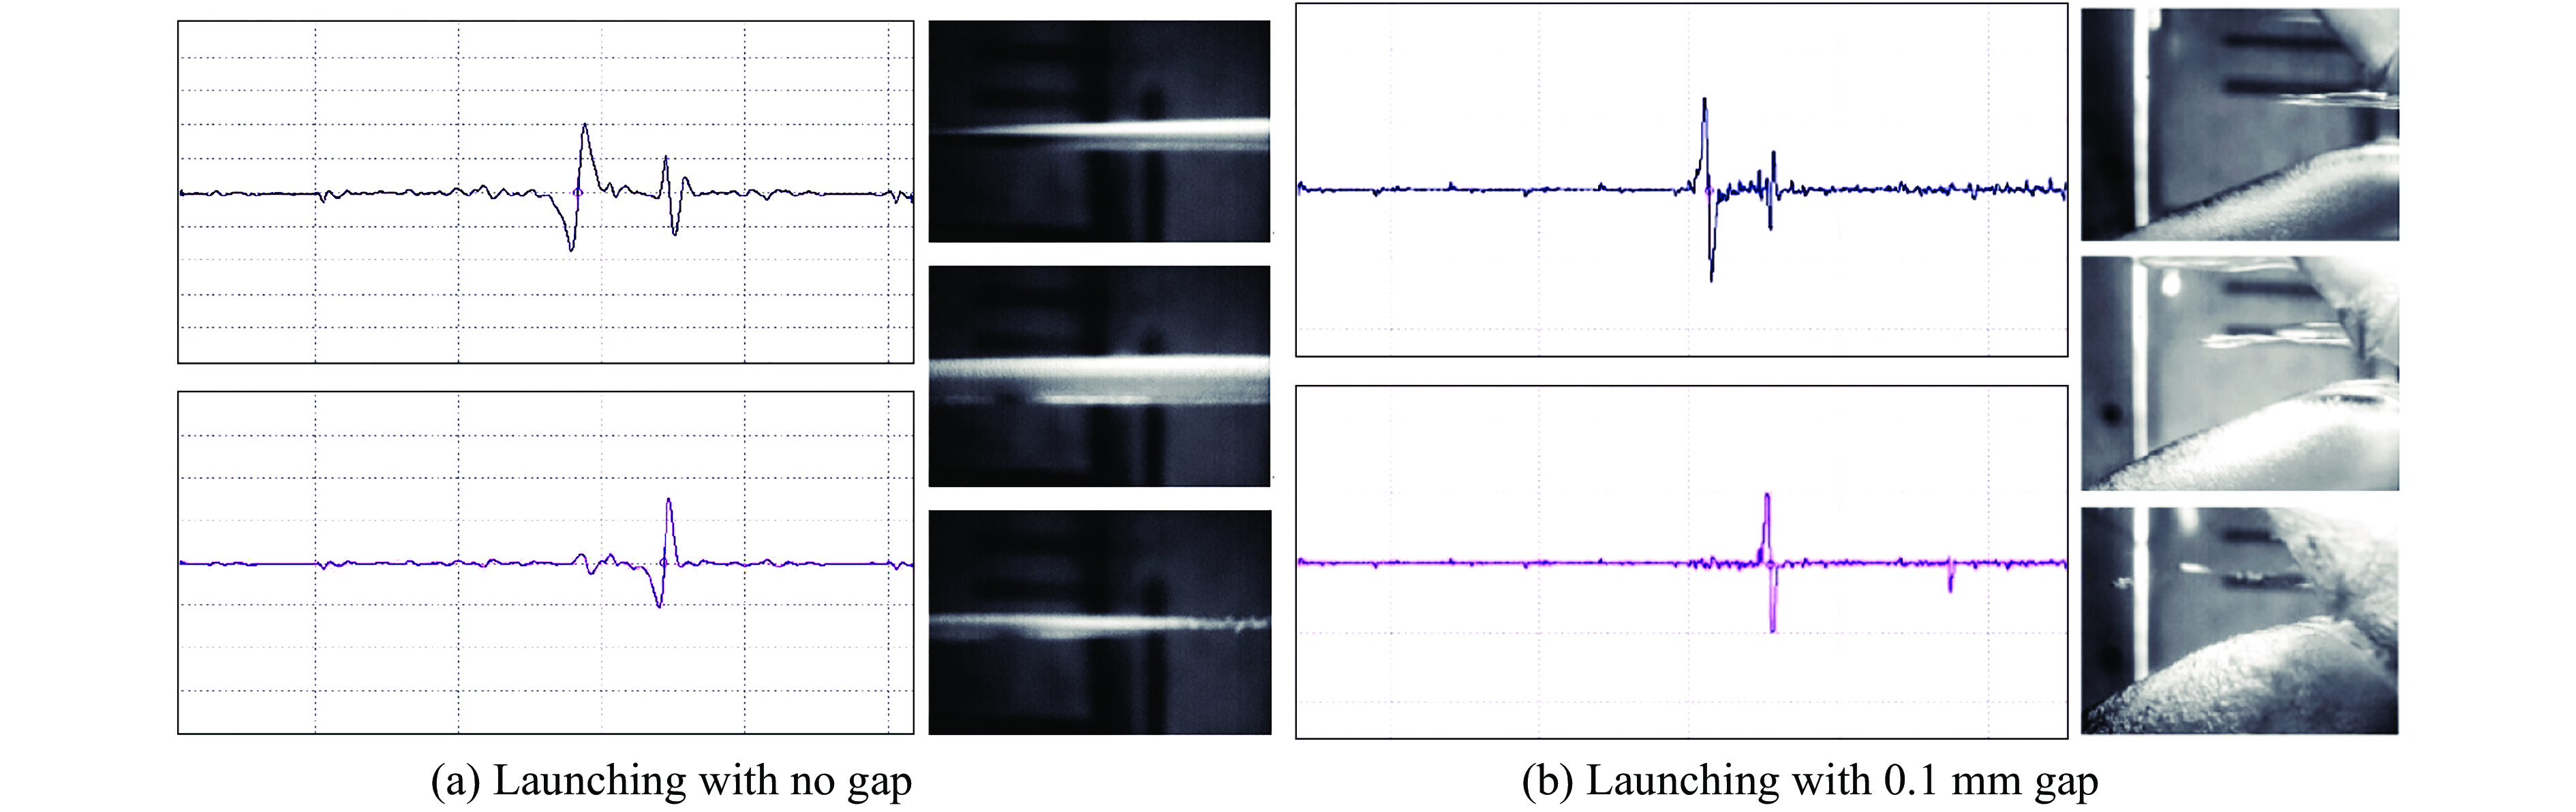
图 14 有、无间隙两种情况下膛压的测试曲线
Figure 14. Pressure curve of the launching with no gap and 0.1 mm gap
表 1 发射药材料参数
Table 1. Material parameters of propellant
Reacted EOS G/mm–1 c C1/(m·s–1) C2 D/(g·cm–3) eg·ρref/(GJ·m–3) 52.17 0.5 500 0 1.003 3 1.88 Solid unreacted EOS Strength: von Mises Bulk modulus/
GPaTref/K Specific heat/
(J·kg–1·K–1)κ /
(W·m–1·K–1)Shear modulus/
GPaYield stress/
MPa13.5 293 0 0 1.38 2 Strength: von Mises Cut offs Maximum temperature/K ρref/(g·cm–3) Maximum
expansionMinimum density factor Minimum sound
speed/(m·s–1)Maximum sound
speed/(m·s–1)1.01 × 1020 1.86 0.01 1 × 10⁻⁴ 1 × 10⁻⁶ 1 × 10⁴ Exponential pg/kPa b/(m·s–1) ρs/(g·cm–3) γ 1.00 × 10⁻⁵ 0.007 1 1 × 10⁻⁶ 1 2.50 × 10⁶ 2.043 2 1 1 5.00 × 10⁶ 3.869 2 2 1 7.50 × 10⁶ 5.623 6 3 1 1.00 × 10⁷ 7.332 9 4 1 1.25 × 10⁷ 9.009 5 5 1 1.50 × 10⁷ 10.660 6 6 1 1.75 × 10⁷ 12.290 6 7 1 2.00 × 10⁷ 13.902 9 8 1 1.00 × 10⁹ 515.278 0 9 1  下载: 导出CSV
表 2 AUTODYN 程序提供的水多项式状态方程参数
Table 2. The polymerization EOS parameters of water provided by the AUTODYN program
A1/GPa A2/GPa A3/GPa T1/GPa T2/GPa B0 B1 2.2 9.54 14.57 2.2 0 0.28 0.28
下载: 导出CSV
表 3 水下射弹实验与数值计算结果
Table 3. Experiment and numerical calculation results of underwater launch
Propellant/
gExperimental results Simulation results Exp. No. Maximum pressure/
MPaVelocity before
the muzzle
(1 m)/(m·s–1)Muzzle velocity/
(m·s–1)Average pressure/
MPaAverage velocity/
(m·s–1)Maximum pressure/
MPaMuzzle velocity/
(m·s–1)21 1 209.9 638.6 659.8 217.8 667.1 223.5 671.7 2 225.7 651.4 674.3 25 1 253.6 771.5 796.1 250.7 799.9 271.3 814.2 2 247.8 778.2 803.7 30 1 413.8 842.7 879.2 427.8 888.0 422.9 883.5 2 441.7 865.8 896.7
下载: 导出CSV
-
[1] 魏平, 侯健, 杨柯. 超空泡射弹研究综述 [J]. 舰船电子工程, 2008(4): 13–17. doi: 10.3969/j.issn.1627-9730.2008.04.004WEI P, HOU J, YANG K, et al. Summary of supercavitating projectile researches [J]. Ship Electronic Engineering, 2008(4): 13–17. doi: 10.3969/j.issn.1627-9730.2008.04.004 [2] 梅雄三. 某水下炮发射口密封特性的分析 [D].南京: 南京理工大学, 2017: 64–65.MEI X S. Analysis of sealing characteristics of underwater gun muzzle [D]. Nanjing: Nanjing University of Science & Technology, 2017: 64–65. [3] 张学伟. 水下超空泡射弹运动仿真与弹道特性分析 [D].太原: 中北大学, 2017: 32–43.ZHANG X W. Motion simulation and ballistic characteristics analysis of underwater supercavitating projectile [D]. Taiyuan: North University of China, 2017: 32–43. [4] HOEFELE E O, BRIMACOMBE J K. Flow regimes in submerged gas injection [J]. Metallurgical Transactions B (Process Metallurgy), 1979, 10(4): 631–648. doi: 10.1007/BF02662566 [5] MORI K, OZAWA Y, SANO M. Characterization of gas jet behavior at a submerged orifice in liquid metal [J]. Transactions of the Iron and Steel Institute of Japan, 1982, 22: 377–384. doi: 10.2355/isijinternational1966.22.377 [6] 施红辉, 郭强, 王超, 等. 水下超音速气体射流胀鼓和回击的关联性研究 [J]. 力学学报, 2010, 42(6): 1206–1210.SHI H H, GUO Q, WANG C, et al. Experiments on the relationship between bulging and back-attack of submerged supersonic gas jets [J]. Chinese Journal of Theoretical and Applied Mechanics, 2010, 42(6): 1206–1210. [7] 薛晓春, 余永刚, 张琦, 等. 渐扩边界形状对双股燃气射流扩展特性影响的实验研究 [J]. 弹道学报, 2013, 25(2): 44–47, 64. doi: 10.3969/j.issn.1004-499X.2013.02.009XUE X C, YU Y G, ZHANG Q, et al. Experimental study on effects of stepped-wall boundary on expansion characteristic of twin combustion-gas jets [J]. Journal of Ballistics, 2013, 25(2): 44–47, 64. doi: 10.3969/j.issn.1004-499X.2013.02.009 [8] 薛晓春, 余永刚, 张琦. 双股燃气射流在充液室内扩展特性的实验研究 [J]. 爆炸与冲击, 2013, 33(5): 449–455. doi: 10.3969/j.issn.1001-1455.2013.05.001XUE X C, YU Y G, ZHANG Q. Experimental study on expansion characteristics of twin combustion-gas jets in liquid-filled chambers [J]. Explosion and Shock Waves, 2013, 33(5): 449–455. doi: 10.3969/j.issn.1001-1455.2013.05.001 [9] 薛晓春, 余永刚, 张琦, 等. 双束燃气射流与整装式液体装药相互作用的实验和数值模拟 [J]. 兵工学报, 2013, 34(6): 669–677.XUE X C, YU Y G, ZHANG Q, et al. Experiment and numerical simulation for interaction of twin gas jets and bulk-loaded liquid charge [J]. Acta Armamentarii, 2013, 34(6): 669–677. [10] 冯博声, 薛晓春. 四股燃气射流在整装式液体中扩展特性的实验研究 [J]. 含能材料, 2017, 25(12): 1004–1010. doi: 10.11943/j.issn.1006-9941.2017.12.006FENG B S, XUE X C. Experimental study on expansion characteristics of four combustion gas jet in bulk-loaded liquid [J]. Chinese Journal of Energetic Materials, 2017, 25(12): 1004–1010. doi: 10.11943/j.issn.1006-9941.2017.12.006 [11] WEILAND C, VLACHOS P P. Round gas jets submerged in water [J]. International Journal of Multiphase Flow, 2013, 48: 46–57. [12] 陈启林.水下燃气射流数值仿真与试验研究 [D].北京: 北京理工大学, 2016: 55–56.CHEN Q L. The Numerical simulation and experimental research on underwater gas jet [D]. Beijing: Beijing Institute of Technology, 2016: 55–56. [13] 汤龙生, 刘宇, 吴智锋, 等. 水下超声速燃气射流气泡的生长及压力波传播特性实验研究 [J]. 推进技术, 2011, 32(3): 417–420.TANG L S, LIU Y, WU Z F, et al. Experimental study on characteristics of bubble growth and pressure wave propagation by supersonic gas jets under water [J]. Journal of Propulsion Technology, 2011, 32(3): 417–420. [14] 周良梁, 余永刚, 曹永杰. 喷射结构对充液圆管内气幕特性影响的数值分析 [J]. 含能材料, 2016, 24(7): 657–663. doi: 10.11943/j.issn.1006-9941.2016.07.006ZHOU L L, YU Y G, CAO Y J. Influence of injection structure on gas-curtain generation characteristics in liquid tube by numerical analysis [J]. Chinese Journal of Energetic Materials, 2016, 24(7): 657–663. doi: 10.11943/j.issn.1006-9941.2016.07.006 [15] 周良梁, 余永刚. 喷头运动对水下气幕生成特性影响的研究 [J]. 推进技术, 2017(4): 239–245.ZHOU L L, YU Y G. Study of sprayer movement influence on underwater gas-curtain generation characteristics [J]. Journal of Propulsion Technology, 2017(4): 239–245. [16] 赵嘉俊, 余永刚. 侧喷孔分布对多股燃气射流在充液室中扩展特性的影响 [J]. 工程力学, 2017(7): 247–254.ZHAO J J, YU Y G. Effects of the distribution of lateral orifices on expansion of multiple combustion gas jets in water-filled chamber [J]. Engineering Mechanics, 2017(7): 247–254. [17] 赵嘉俊, 余永刚. 柱形充液室内多股燃气射流流场的气体与液体两相流场演化特性 [J]. 兵工学报, 2016, 37(10): 1852–1859. doi: 10.3969/j.issn.1000-1093.2016.10.012ZHAO J J, YU Y G. The evolution of gas-liquid flow of multiple combustion gas jets in a cylindrical water-filled chamber [J]. Acta Armamentarii, 2016, 37(10): 1852–1859. doi: 10.3969/j.issn.1000-1093.2016.10.012 [18] 赵嘉俊, 余永刚. 锥形多股火药燃气射流与液体工质相互作用的实验研究 [J]. 含能材料, 2015, 23(11): 1055–1060. doi: 10.11943/j.issn.1006-9941.2015.11.004ZHAO J J, YU Y G. Interaction between cone-shaped multiple combustion gas jets and liquid [J]. Chinese Journal of Energetic Materials, 2015, 23(11): 1055–1060. doi: 10.11943/j.issn.1006-9941.2015.11.004 [19] 秦会国, 马峰, 仲霄, 等. 水中弹药的电磁感应测速方法研究 [J]. 测试技术学报, 2012, 26(4): 281–287.QIN H G, MA F, ZHONG X, et al. Velocity measurement method of underwater projectile based on electromagnetic induction [J]. Journal of Test and Measurement Technology, 2012, 26(4): 281–287. [20] 黄闯. 跨声速超空泡射弹的弹道特性研究 [D]. 西安: 西北工业大学, 2017: 117–126.HUANG C. Research of trajectory characteristics of supersonic-supercavitating projectiles [D]. Xi’an: Northwestern Polytechnical University, 2017: 117–126. -

 下载:
下载:


计量
- 文章访问数: 8722
- HTML全文浏览量: 3262
- PDF下载量: 28
