


Free Vibrations of Pre/Post-Buckled Graphene-Reinforced Epoxy Resin Matrix Nanocomposite Beams
-
摘要: 采用微分求积法分析了石墨烯增强纳米复合材料梁屈曲前后的自由振动问题。考虑石墨烯纳米片在基体中随机排列和定向排列的情况,采用Halpin-Tsai微观力学模型估算两种模式下石墨烯纳米复合材料的弹性模量,并通过Hamilton原理建立基于一阶剪切变形理论下梁的动力学控制方程。利用微分求积法计算得到石墨烯纳米复合材料梁的临界屈曲载荷及屈曲前后的固有频率。数值计算结果表明:按合理排列模式掺杂较多的薄石墨烯纳米片,会大幅度提高梁的临界屈曲载荷以及屈曲前的固有频率;但屈曲发生后,同样的做法却会使结构的刚度降低。Abstract: Free vibration of pre/post-buckled graphene-reinforced nanocomposite beams was analyzed by the differential quadrature method. Considering the random distribution and directional arrangement of graphene nanoplatelets in the matrix, Young’s moduli of graphene nanocomposites in two modes were estimated by Halpin-Tsai micromechanical model. The first-order shear deformation theory was used to establish the governing equations of beams by Hamilton principle. The critical buckling loads of the graphene-reinforced nanocomposite beam and the natural frequencies in the pre/post-buckling regimes were calculated by the differential quadrature method. Numerical results show that dispersing more graphene platelets with less single layers and arranging them in a reasonable mode will greatly increase the critical buckling loads of the beams and the natural frequencies in pre-buckling regime. However, the same approach reduces the stiffnesses of the beams in the post-buckling regime.
-
Key words:
- graphene /
- distribution mode /
- differential quadrature method /
- buckling /
- natural frequency
-

图 1 石墨烯纳米片在基体材料中的排列模式:(a)随机排列;(b)定向排列
Figure 1. Arrangement modes of graphene nanosheets in matrix materials: (a) random distribution; (b) orientation distribution

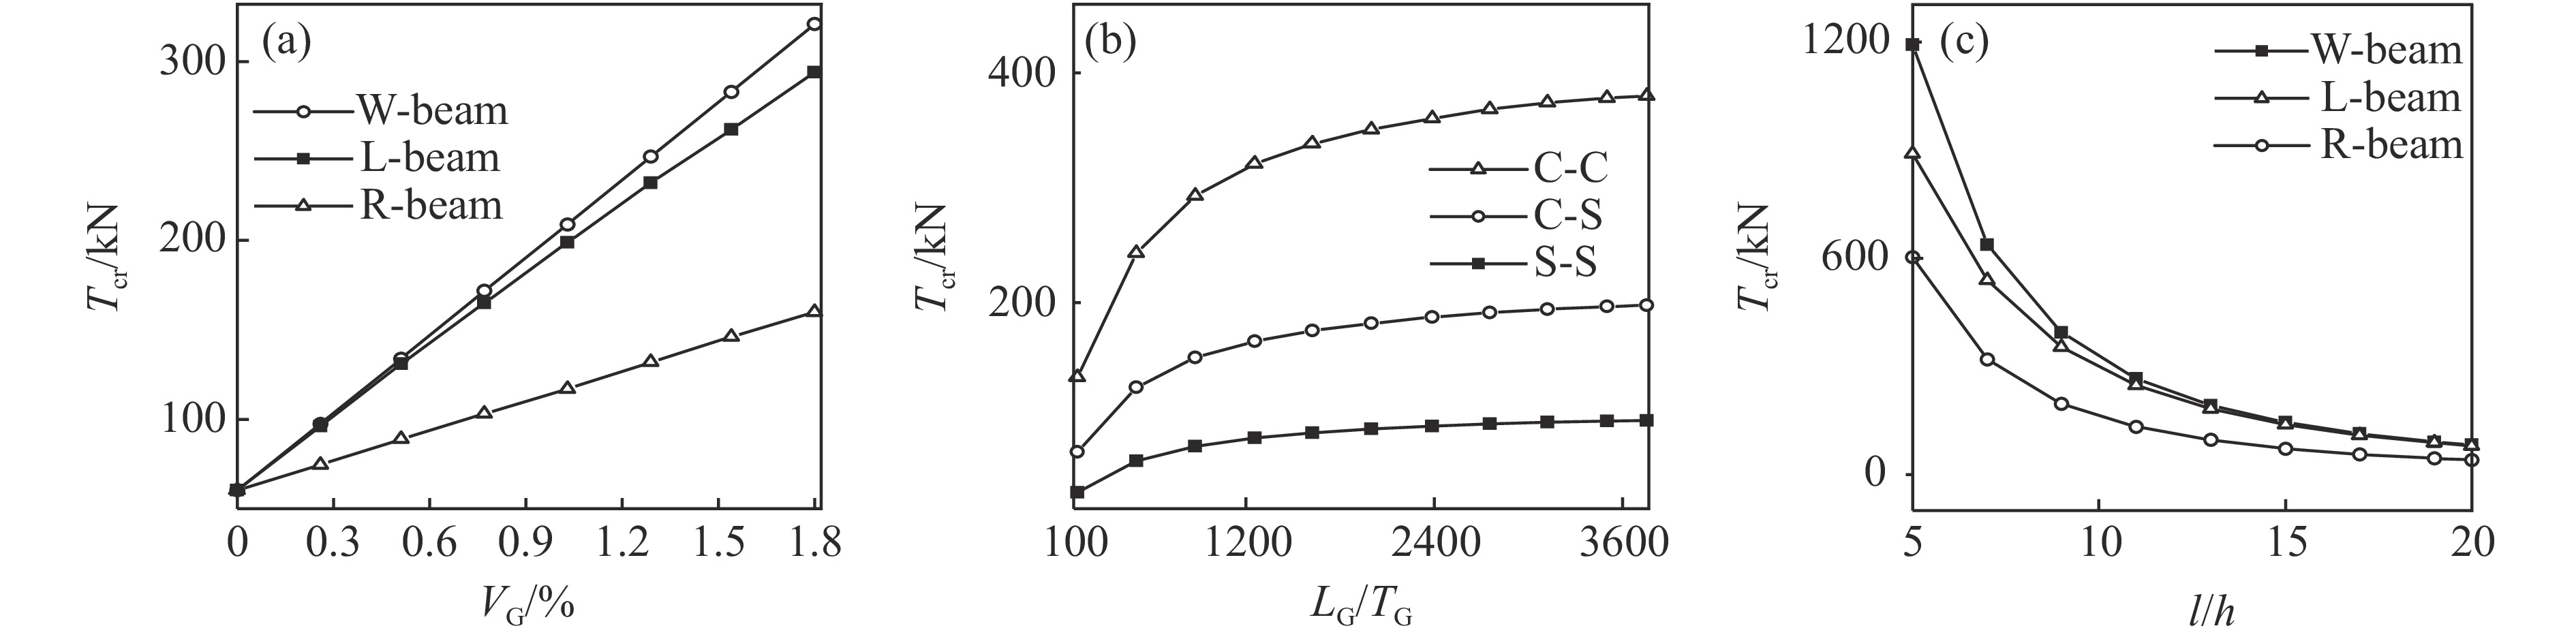
图 2 不同条件下石墨烯纳米复合材料梁的临界屈曲荷载:(a)石墨烯纳米片的浓度不同;(b)石墨烯纳米片的长厚比不同;(c)梁的长细比不同
Figure 2. Critical buckling loads of graphene-reinforced nanocomposite beams under different conditions:(a) different concentrations of GPLs; (b) different aspect ratios of GPLs; (c) different length-to-thickness ratios of beams

图 3 S-S约束下R-梁的前4阶临界屈曲模态
Figure 3. The first four-order critical buckling modes of R-beam under S-S boundary condition

图 4 轴向力对不同模式梁第一阶固有频率的影响
Figure 4. Effect of axial force on the first-order natural frequency of beams with different GPL distribution modes

图 7 轴向力对不同约束下梁固有频率的影响
Figure 7. Effect of axial force on the natural frequencies of beams with different boundary conditions

图 5 轴向力对不同浓度下W-梁固有频率的影响
Figure 5. Effect of axial force on natural frequencies of W-beam with different graphene concentrations

图 6 不同长厚比的GPLs对梁固有频率的影响
Figure 6. Effect of GPL length-to-thickness ratio on the natural frequencies of beams
表 1 定向排列状态下片状增强纳米复合材料增强因子
Table 1. Enhancement factors of flake reinforced nanocomposites
Material parameter ${\zeta }$ ${{G_{12}}}$ ${3{L_{\rm G}}/4{T_{\rm G}}}$ ${{G_{13}}}$,${{G_{23}}}$ ${{L_{\rm G}}/{T_{\rm G}}}$  下载: 导出CSV
表 3 不同约束下石墨烯纳米复合材料梁的一阶屈曲荷载
Table 3. The first-order critical buckling load of graphene-reinforced nanocomposite beams with different boundary conditions
Boundary condition R-beam L-beam W-beam Euler beam This work Euler beam This work Euler beam This work S-S 40.93 40.76 82.16 79.87 82.16 81.72 C-C 163.71 160.36 328.65 293.84 328.65 320.72 C-S 83.53 82.98 167.68 158.00 167.68 166.23
下载: 导出CSV
-
[1] SASHA S, DIKIN D A, DOMMETT G H B, et al. Graphene-based composite materials [J]. Nature, 1990, 442(2): 282–283. [2] RAHMAN R, HAQUE A. Molecular modeling of crosslinked graphene-epoxy nanocomposites for characterization of elastic constants and interfacial properties [J]. Composites Part B: Engineering, 2013, 54(9): 353–364. [3] JI X Y, CAO Y P, FENG X Q. Micromechanics prediction of the effective elastic moduli of graphene sheet-reinforced polymer nanocomposites [J]. Modelling & Simulation in Materialsence & Engineering, 2010, 18(4): 1–16. [4] KING J A, KLIMEK D R, MISKIOGLU I, et al. Mechanical properties of graphene nanoplatelet/epoxy composites [J]. Journal of Applied Polymer Science, 2013, 128(6): 4217–4223. doi: 10.1002/app.v128.6 [5] ZHAO X, ZHANG Q, CHEN D, et al. Enhanced mechanical properties of graphene-based poly (vinyl alcohol) composites [J]. Macromolecules, 2010, 43(5): 2357–2363. doi: 10.1021/ma902862u [6] RAFIEE M, RAFIEE J, YU Z Z, et al. Buckling resistant graphene nanocomposites [J]. Applied Physics Letters, 2009, 95(22): 10–18. [7] NGUYEN T K, VO T P, THAI H T. Static and free vibration of axially loaded functionally graded beams based on the first-order shear deformation theory [J]. Composites Part B: Engineering, 2013, 55(55): 147–157. [8] PARASHAR A, MERTINY P. Representative volume element to estimate buckling behavior of graphene/polymer nanocomposite [J]. Nanoscale Research Letters, 2012, 7(1): 515–518. doi: 10.1186/1556-276X-7-515 [9] FENG C, KITIPORNCHAI S, YANG J. Nonlinear bending of polymer nanocomposite beams reinforced with non-uniformly distributed graphene platelets (GPLs) [J]. Composites Part B: Engineering, 2017, 110(1): 132–140. [10] YANG J, WU H, KITIPORNCHAI S. Buckling and postbuckling of functionally graded multilayer graphene platelet-reinforced composite beams [J]. Composite Structures, 2017, 161(1): 111–118. [11] LIAN G, TUAN C C, LI L, et al. Vertically aligned and interconnected graphene networks for high thermal conductivity of epoxy composites with ultralow loading [J]. Chemistry of Materials, 2016, 28(17): 6096–6104. doi: 10.1021/acs.chemmater.6b01595 [12] WU S, LADANI R B, JIN Z, et al. Aligning multilayer graphene flakes with an external electric field to improve multifunctional properties of epoxy nanocomposites [J]. Carbon, 2015, 94(1): 607–618. [13] ZHANG Y F, HAN D, ZHAO Y H, et al. High-performance thermal interface materials consisting of vertically aligned graphene film and polymer [J]. Carbon, 2016, 109(1): 552–557. [14] 韩依廷. 定向排列石墨烯/聚合物复合材料研究进展 [J]. 石化技术, 2017, 24(12): 207–208. doi: 10.3969/j.issn.1006-0235.2017.12.167HAN Y T. Research progress of directional arrangement of graphene/polymer composites [J]. Petrochemical Industry Technology, 2017, 24(12): 207–208. doi: 10.3969/j.issn.1006-0235.2017.12.167 [15] AFFDL J C H, KARDOS J L. The Halpin-Tsai equations: a review [J]. Polymer Engineering & Science, 1976, 16(5): 344–352. [16] WANG F, LIAO X, XIONG X. Characteristics of the differential quadrature method and its improvement [J]. Mathematical Problems in Engineering, 2015(6): 1–9. [17] CHOUDHURY A. Preparation and characterization of nanocomposites of poly-p-phenylene benzobisthiazole with graphene nanosheets [J]. Rsc Advances, 2014, 4(17): 8865–8870. [18] VAN ES M. Polymer-clay nanocomposites: the importance of particle dimensions [D]. Delft, Netherlands: Delft University of Technology, 2001: 18–37. [19] BERT C W. Differential quadrature and its application in engineering, by Chang Shu, Springer, London, 2000 [J]. International Journal of Robust & Nonlinear Control, 2010, 11(14): 1398–1399. [20] LIU X, METCALF T H, ROBINSON J T, et al. Shear modulus of monolayer graphene prepared by chemical vapor deposition [J]. Nano Letters, 2012, 12(2): 1013–1017. doi: 10.1021/nl204196v [21] YASMIN A, DANIEL I M. Mechanical and thermal properties of graphite platelet/epoxy composites [J]. Polymer, 2004, 45(24): 8211–8219. doi: 10.1016/j.polymer.2004.09.054 [22] RAFIEE M A, JAVAD R, ZHOU W, et al. Enhanced mechanical properties of nanocomposites at low graphene content [J]. Acs Nano, 2009, 3(12): 3884–3890. doi: 10.1021/nn9010472 [23] XIAO L, METCALF T H, ROBINSON J T, et al. Internal friction and shear modulus of graphene films [J]. Solid State Phenomena, 2012, 184(1): 319–324. [24] LIANG J, YI H, LONG Z, et al. Molecular-level dispersion of graphene into poly (vinyl alcohol) and effective reinforcement of their nanocomposites [J]. Advanced Functional Materials, 2010, 19(14): 2297–2302. -

 下载:
下载:


计量
- 文章访问数: 7307
- HTML全文浏览量: 3804
- PDF下载量: 23
